อินดิเคเตอร์
อินดิเคเตอร์
กลยุทธ์
อินดิเคเตอร์

อินดิเคเตอร์
อินดิเคเตอร์

Extreme VolumeThis indicator colors volume bars that are significantly higher volume than the vol moving average ( SMA ). Utilizes two multiplier that can be adjusted by user. Defaults are that the indicator colors volume bars yellow if 20% higher than average, and orange if over 50% higher than average.
Reason why i created this indicator is i typically don't care about volume unless it is significantly higher than average. I find extreme volume useful for confirmation of a breakout, etc. This is why the rest of the volume bars are gray, they are still available for reference, but I dont pay much attention until volume is higher than average.
Also, when you load this indicator it will be in its own pane below the chart. To try and figure out how to add it to same pane as the chart was a huge pain in the ass. Once you figure it out it is pretty easy. I'll try to explain below...
Next to the indicator name you have the following options ... Hide, Settings, Show Source Code{}, Delete(X), and More (3 dots)
1) Click on "More" (3 dots)
2) Click on "Move To" then chose "Existing Pane Above"
3) Volume will likely be too large. Volume scale should be on left side, use your mouse to adjust volume smaller
4) Volume will likely be in the middle of your chart, click on it and drag it down.
อินดิเคเตอร์

อินดิเคเตอร์

อินดิเคเตอร์

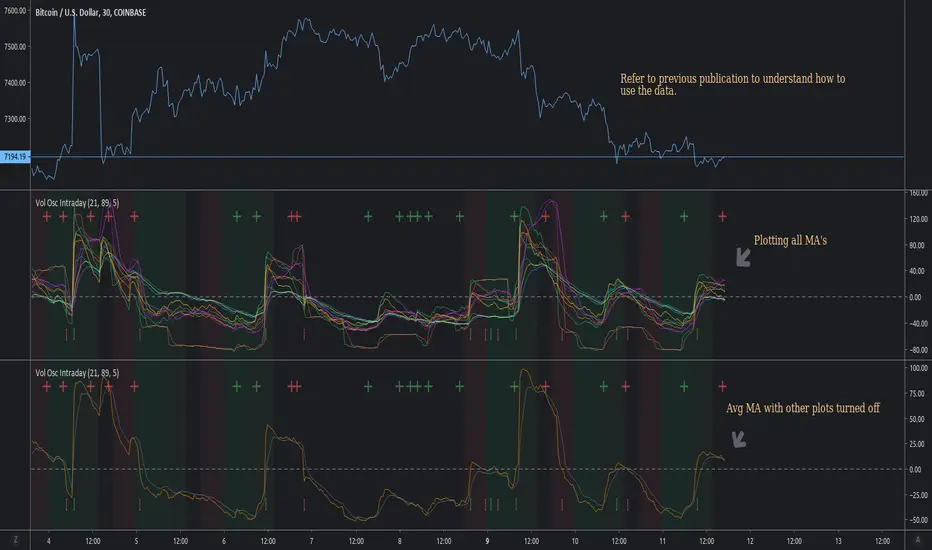
Slow Volume Oscillator Indicator - Just a Better Way To TradeThis script is nothing new. However, I feel that traders do not know the full potential it can provide if they just increase the lookback periods.
Tradingview's default Vol Osc uses a fast setting of 5 and a slow setting of 10. It just paints pointless scribbling. Slow all your indicators down and wake up to a whole new world of Technical Analysis.
To create consistency with variables I typically use Fib numbers for lookback periods. (3,5,8,13,21,34,55,89,144,233,377,610,987)
As noted in chart. An increase in volume can be either bullish or bearish. It's up to you to decide which way price action will move.
If you use with other indicators you can create more confirmations.
More confirmations = peace of mind
My favorite indicators are (Detrended Price Oscillator, Momentum, MACD, Chaikin Money Flow, Ultimate Oscillator, and this Volume Oscillator)
Here is just one example of MACD strategy indicator that can be used with this Vol Oscillator
อินดิเคเตอร์

อินดิเคเตอร์

อินดิเคเตอร์

อินดิเคเตอร์

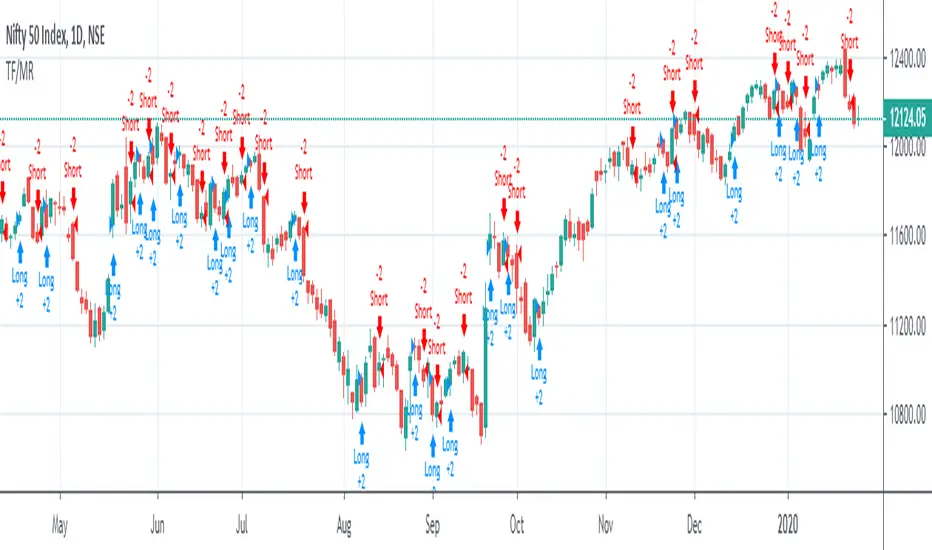
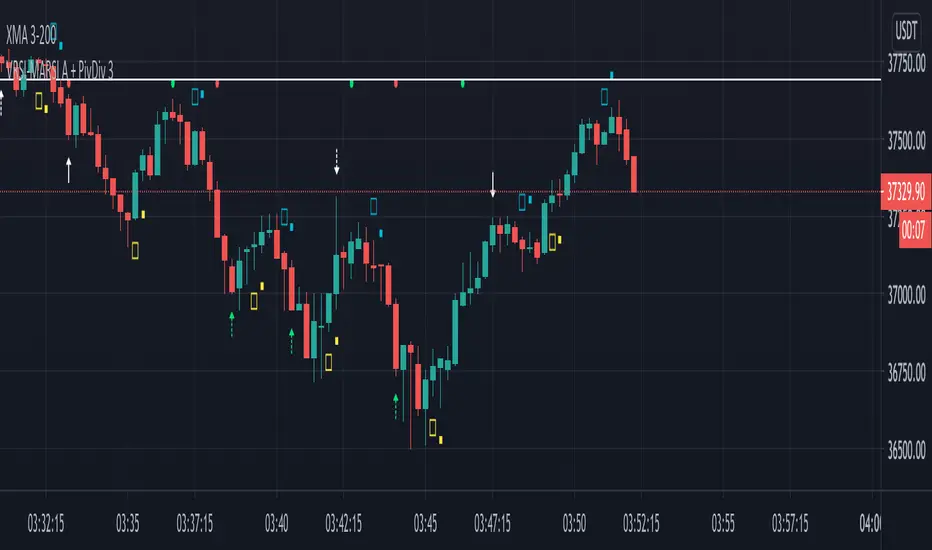
VRSI-MARSI StrategyI wanted to create an indicator which resembles price movement, aside to volume movement.
The "yellow-blue" line is the MA(5) of the RSI (9) of closing price.
The "orange" line is the MA(5) of the RSI (9) of Volume .
(Default plot of RSI and VRSI is not visible but can be made visible ("Settings" > "Style" > set "Opacity" of "RSI & VRSI"))
The Long (Buy) condition is triggered when the MA(5) of the RSI (9, close) goes up.
The Short (Sell) condition is triggered when the MA(5) of the RSI (9, close) goes down.
Comparing the price movement with the "orange" Volume line helps to spot a possible trend change,
for example when price goes up and an ascending Volume line starts to flatten or starts descending,
this could be a sign that the Bullish trend is weakening, predicting a possible trend change.
Or, when for example a downwards price movement is accompanied with a rising Volume line, this can be a sign of large Bearish power.
Because it still is a RSI indicator, the midline (50), and Oversold/Overbought area's (20-30 & 70-80) are important to watch, especially the MARSI!
A second strategy is made (VRSI-MARSI Strategy 2) where the Long/Short condition is triggered when "MA RSI (close) - MA RSI ( Volume )" crosses.
-------------------------------------------------------------------------------------------------------------------------------------------------------------------------
The Long & Short entries, as well as the Entry Close are visible 1 bar after the trigger.
When the blue line changes in a yellow line (and vice versa) it will show a candle earlier (see yellow dashed lines = (1)).
Also, the condition is fulfilled when the candle closes (2), but the order doesn't take place in the same bar, but the next (3).
Because this is a strategy the "actual Order" will not take place at the "Close" of the candle (2), but at the "Open" at the NEXT candle (3).
I also have this strategy as a study (A+B), where the "Buy" & "Sell" shows a candle earlier.
-------------------------------------------------------------------------------------------------------------------------------------------------------------------------
The entries are default 5% of equity, without pyramiding, which already gives large profits.
A large part of the profit is because of the Entry Close of the Long & Short entries.
You can easily turn these off (Settings > Inputs) to see what profit the strategy gives without Entry Close.
Here they are disabled:
-------------------------------------------------------------------------------------------------------------------------------------------------------------------------
More information available in the script ;-)
กลยุทธ์

VRSI-MARSI AI wanted to create an indicator which resembles price movement, aside to volume movement.
MARSI (= MA RSI(close)) = "yellow-blue" line which is the MA(5) of the RSI (9) of closing price.
VRSI (= MA RSI(Volume)) = "orange" line which is the MA(5) of the RSI (9) of Volume .
(Default plot of RSI and VRSI is not visible but can be made visible ("Settings" > "Style" > set "Opacity" of "RSI & VRSI"))
Because it still is a RSI indicator, the midline (50), and Oversold/Overbought area's (20-30 & 70-80) are important to watch, especially the MARSI!
Comparing the price movement with the "orange" Volume VRSI line helps to spot a possible trend change,
for example when price goes up and an ascending Volume VRSI line starts to flatten or starts descending,
this could be a sign that the Bullish trend is weakening, predicting a possible trend change.
Or, when for example a downwards price movement is accompanied with a rising Volume VRSI line, this can be a sign of large Bearish power.
This study comes with Bollinger Bands as an assisting tool, it is default made not visible but can be made visible
("settings" > "style" > Set "Opacity" of "basis, upper & lower")
You can see where the MARSI ("yellow-blue" line) crosses the "basis", or bounces off the bands, ...
All this is seen in "VRSI-MARSI B"
"VRSI-MARSI A" contains the alerts:
1) Long/Short = "Triangle UP/DOWN", color: lime/red
Condition: Movement of MA(5) of RSI (9) of price (close )
2) Long2/Short2 = ">", color: lime/red
Condition: Long/Short condition is true for 2 or more bars (= continuation)
3) Long3/Short3 = "•", color: lime/red
Condition: MA RSI (Close) crosses MA RSI ( Volume )
1 or more alerts can easily be disabled if desired (settings > inputs)
Thanks!
-------------------------------------------------------------------------------------------------------------------------------------------------------------------------
More information available in the script ;-) อินดิเคเตอร์
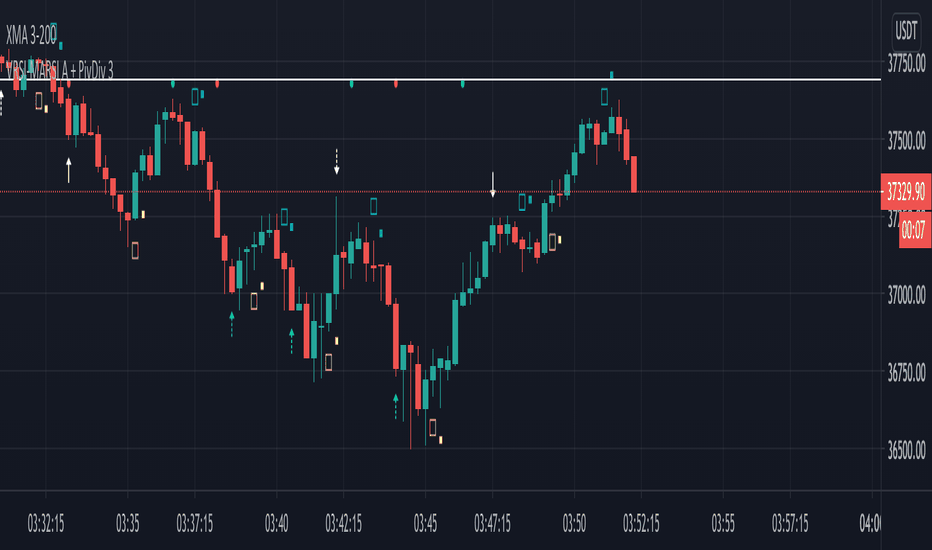
VRSI-MARSI BI wanted to create an indicator which resembles price movement, aside to volume movement.
MARSI (= MA RSI(close)) = "yellow-blue" line which is the MA(5) of the RSI (9) of closing price.
VRSI (= MA RSI(Volume)) = "orange" line which is the MA(5) of the RSI (9) of Volume .
(Default plot of RSI and VRSI is not visible but can be made visible ("Settings" > "Style" > set "Opacity" of "RSI & VRSI"))
Because it still is a RSI indicator, the midline (50), and Oversold/Overbought area's (20-30 & 70-80) are important to watch, especially the MARSI!
Comparing the price movement with the "orange" Volume VRSI line helps to spot a possible trend change,
for example when price goes up and an ascending Volume VRSI line starts to flatten or starts descending,
this could be a sign that the Bullish trend is weakening, predicting a possible trend change.
Or, when for example a downwards price movement is accompanied with a rising Volume VRSI line, this can be a sign of large Bearish power.
This study comes with Bollinger Bands as an assisting tool, it is default made not visible but can be made visible
("settings" > "style" > Set "Opacity" of "basis, upper & lower")
You can see where the MARSI ("yellow-blue" line) crosses the "basis", or bounces off the bands, ...
All this is seen in "VRSI-MARSI B"
"VRSI-MARSI A" contains the alerts:
1) Long/Short = "Triangle UP/DOWN", color: lime/red
Condition: Movement of MA(5) of RSI (9) of price (close )
2) Long2/Short2 = ">", color: lime/red
Condition: Long/Short condition is true for 2 or more bars (= continuation)
3) Long3/Short3 = "•", color: lime/red
Condition: MA RSI (Close) crosses MA RSI ( Volume )
1 or more alerts can easily be disabled if desired (settings > inputs)
Thanks!
-------------------------------------------------------------------------------------------------------------------------------------------------------------------------
More information available in the script ;-) อินดิเคเตอร์

อินดิเคเตอร์

อินดิเคเตอร์

อินดิเคเตอร์
อินดิเคเตอร์

Range Force Impulse The "Range Force Impulse" indicator combines 4 useful indicators into one, freeing up chart real-estate and giving the trader insight into trend health, bull/bear commitment, range and volatility all at a glance.
The indicator consists of the following:
Direction - True Range and Average True Range columns shown above and below 0 depending on direction of the period's price
-- TR (gray) shows the current period's trading volatility
-- ATR (Impulse colors, see below) shows an EMA of TR over a specified length
-- Can be used to determine stops and targets (Example: Stop loss at prev close - ATR, Target at 2x ATR)
Index - Alexander Elder's EMA of (change(close) * volume), shows crosses above 0 (green) and below 0 (red), and intermediate signals
-- Shows bull vs. bear interest/commitment/dominance
-- Elder recommends EMA length of 2 for daily chart buy/sell signals, and 13 for weekly chart bull/bear dominance & trend direction signals
-- Intermediate signals are shown above 0 when falling (salmon), or below 0 when rising (pale yellow)
System - Range columns are colored using Alexander Elder's censorship system (green: do not short, red: do not long, blue: is up to you)
-- Shows overall trend health (Macd histogram and EMA up/down changes)
อินดิเคเตอร์

อินดิเคเตอร์

กลยุทธ์