ATK/DEF HIGH LOW Fibonacci Battlefield ATK/DEF HIGH LOW Fibonacci Battlefield is a multi-factor market structure analysis framework designed to evalua the quality and behavior characte of swing highs and swing lows through the combination of Fibonacci positio, pric behavior, liquidity activity, and market pressure analysis.
Unlike traditional swing high and swing low identification tools that only mark histori tur poin based on pric locatn, this indicator focuses on stu the internal characts behind each detec high and low area.
The purpose of this framework is to provide additional structural context by evalua ho price interact with important swing locatio and how market activity changes around those areas.
The indicator combines three major analytical components into a unified battlefield evalua model:
1. Fibonacci Battlefield Structure
The Fibonacci Battlefield module evalua the position of pric within the current histori rang and analyzes the relationship between swing points and Fibonacci-based pric areas.
This component studies:
• Current pric location within the measured range
• Fibonacci retracement positionin Distance between pric and important Fibonacci lev
• Structural reaction areas around previous highs and lows
Instead of treati Fibonacci leve as isolated horizontal lines, this module uses Fibonacci positioning as a framework to analyze the relative location and condition of pric within a market structure.
The module provides a structural perspecti of whether historical swing areas are located near important Fibonacci zo and how these areas relae to current pric behavior.
2. Whirlpool Pressure Index
The Whirlpool Pressure Index evalua candle behavior and internal pric pressure by analyzing the relationship between bu pressure and se pressure.
This component examines:
• Candle rang distribution
• Closing position within the candle range
• Bu and se pressure balance
• Current pressure intensity around pric areas
The purpose of this calcula is to measure the behavioral characteristics of pric movement and understand the strength of interacti occurring near detec swing highs and swing lows.
It does not attempt to predfuture movement. Instead, it provides a quantimeasurement of current pric behavior based on historical candle information.
3. Liquidity Accelerator / Decelerator
The Liquidity Accelerator / Decelerator module evaluat changes in activity by analyzing volume behavior relative to its historic average.
This component focuses on:
• Relative volume activity
• Changes in market participation
• Liquidity expansion and contrac conditions
• Volume activity intensity around pric movement
The volume calcula is used as a market activity measurement and control reference, helping evalua whether a swing area is formed during stronger or weaker participation conditions.
This module represents volume activity analysis and is not a volume distribution profile or volume profile visualization.
High / Low Behavior Evaluation
The indicator identif swing highs and swing lows and attach multiple analytical measurements to each structural point.
Each detected high and low area can be evaluated through:
• Fibonacci structural position
• Price reaction characteristics
• Pressure condition
• Liquidity activity
• Market behavior context
This allows historical swing locatio to be stubeyond simple pric levels.
The framework focuses on the quality and characteristics of swing points rather than only identifyi where previous highs and lows occurred.
Integrated Battlefield Dashboard
The dashboard combines multiple analytical measurements into a compact information panel.
Displayed information includes:
• Fibonacci structural condition
• Pressure balance measurement
• Liquidity activity condition
• Flow balance characteristics
• Current market environment status
The dashboard is designed to provide a structured overview of market behavior and pric conditions from multiple perspectives.
Market Condition Analysis
The market condition module evaluat the current relationship between pric exten, momentum characteristics, and recent pric range behavior.
It analyzes:
• RSI positioning
• Recent pric extremes
• Momentum condition
• Pric and oscillator relationship
This component is designed to describe the current market environment and highlight changes in pric behavior characteristics.
It is a condition measurement tool based on historical market data rather than a prediction system.
Core Features
• Swing High and Swing Low structural analysis
• Fibonacci-based battlefield framework
• Pric behavior evaluati
• Candle pressure measurement
• Volume activity analysis
• Liquidity condition tracking
• Multi-factor market structure dashboard
• Historical swing point contextual analysis
• Quantitative evaluat of pric areas
• Integrat structural and behavioral analysis framework
Concept
ATK/DEF HIGH LOW Fibonacci Battlefield is designed to stu the relationship between pric structure, market participation, and behavioral characteristics.
Traditional swing tools mainy focus on identifying previous highs and lows. This framework expas the analysis by combining structural position, candle behavior, and volume activity to evalua the characteris behind each swing location.
All calculat are derived from historical market data and are intended for market research, technical analysis, and structural observation purposes.
The displayed values represent analytical measurements of pric behavior, liquidity conditions, and market structure characteristics. อินดิเคเตอร์

Vortex Signals [Gabremoku]Vortex Signals is a reworked version of the classic Vortex Indicator designed to make directional shifts easier to read and less reactive than raw crossover-based interpretations.
Instead of treating every VI+ / VI- crossover as a direct trading signal, this script uses the Vortex lines as a regime detector first, then looks for signal quality through spread expansion and re-activation after a pullback. The goal is to reduce the noisy sequence of repeated entries and exits that often appears when the standard Vortex is used on its own.
What the script does:
Plots the classic Vortex components, VI+ and VI-.
Fills the space between the two lines with a dynamic gradient that reflects which side is dominant and how strong the current spread is.
Detects bullish and bearish dominance regimes.
Uses a signal engine based on regime change, spread expansion, and first valid continuation after weakening.
Prints compact chart markers for LONG, SHORT, and CLOSE events.
Includes a dashboard to show current state, sequence status, setup condition, spread, slope, and directional bias.
How it works:
Regime: the script first determines whether VI+ is above VI- or VI- is above VI+.
Spread: it measures the distance between the two Vortex lines to evaluate whether dominance is meaningful or weak.
Expansion: a regime becomes more relevant when the spread rises above its short baseline and continues widening.
Trigger logic: instead of firing on every crossover, the script waits for either an early valid impulse after regime change or the first useful re-expansion after a pullback inside the same regime.
Why this is different from the classic Vortex:
The built-in Vortex is often read through raw line crossovers.
This script reframes the indicator as a dominance and continuation tool rather than a pure crossover trigger.
The signal engine is designed to capture cleaner transitions and continuation phases while avoiding part of the back-and-forth noise that often occurs in choppy conditions.
How to use it:
In Long mode, focus on bullish dominance and the appearance of a LONG marker after spread expansion or re-expansion.
In Short mode, focus on bearish dominance and the appearance of a SHORT marker after the same logic on the opposite side.
CLOSE markers appear when the opposite Vortex condition breaks the active sequence.
Suggested use:
This script is generally better suited to trending or directional environments than to highly compressed sideways markets.
In my testing and chart observation, the signals can appear cleaner on the 1H timeframe, where short-term noise is often reduced compared with very low timeframes, but users should still adapt settings to the instrument and market structure they trade.
Notes:
This indicator is not predictive and does not guarantee profitable signals.
It should be used as a decision-support tool together with price structure, risk management, and broader market context.
As with any directional model, false signals can still occur during whipsaw or transition phases. อินดิเคเตอร์

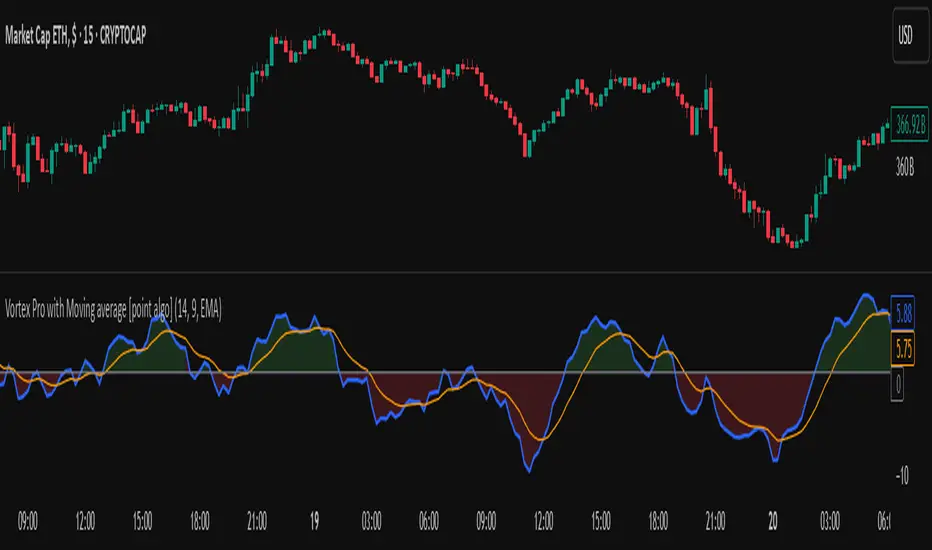
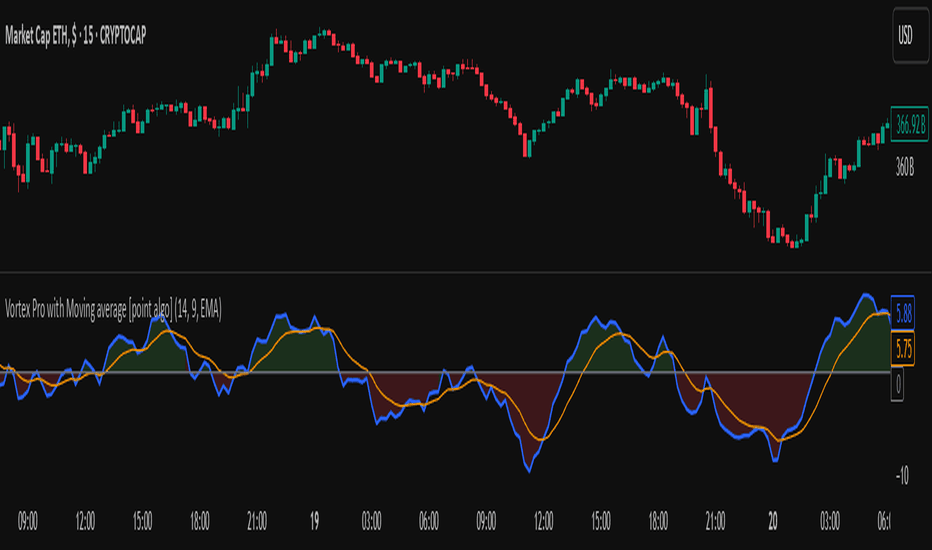
Vortex Pro with Moving average [point algo]Vortex Pro with MA Dropdown is an enhanced version of the classic Vortex Indicator (VI), designed to help visualize directional strength by comparing positive and negative trend movement.
This version includes a smoothed “Vortex Pro” line, adjustable moving-average filtering, and dynamic zone coloring for improved readability.
How It Works:
The script calculates VI+ and VI− using directional movement and true range.
“Vortex Pro” is derived from the difference between VI+ and VI−, scaled for clarity.
A customizable moving average (EMA, SMA, HMA, WMA) is applied to help smooth volatility and highlight shifts in momentum.
Features :
• Vortex Pro Line
A scaled trend-strength line showing when positive movement is dominating or weakening.
• MA Type Dropdown
Choose between EMA, SMA, HMA, or WMA to smooth the Vortex Pro line.
• Zero-Line Structure
A plotted zero line is used to compare positive vs. negative strength visually.
• Dynamic Fill Zones
Green shading when the Vortex Pro line is above zero, red when below.
Usage:
This tool is designed for visual analysis of trend direction and momentum strength.
It does not generate buy/sell signals and should be used as part of a broader analysis approach.
Suitable for all timeframes and markets. อินดิเคเตอร์
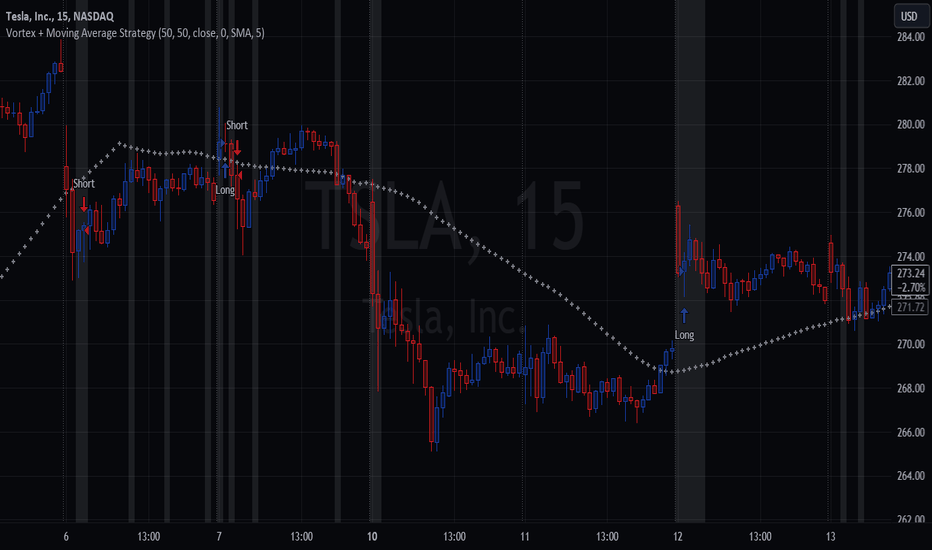
Vortex Cross w/MA ConfirmationThis script is a trading strategy that combines the Vortex Indicator and a Moving Average (MA) to generate potential entry signals for long and short positions.
1. Vortex Indicator:
The Vortex Indicator consists of two lines: Vortex Positive (VIP) and Vortex Negative (VIM). It is designed to identify trend direction and measure the strength of a trend.
2. Moving Average (MA):
The script uses a chosen type of Moving Average (SMA, EMA, SMMA, WMA, or VWMA) to smooth the price data. The smoothed line is referred to as the "Smoothing Line."
3. Determine Long and Short Conditions:
The script looks for potential long entry signals when VIP crosses above VIM, highlighting each crossover on the chart, and the closing price is above the Smoothing Line. It searches for short entry signals when VIM crosses above VIP, with the closing price is below the Smoothing Line. When the long or short conditions are met, the strategy enters either a long or short position accordingly.
Potential Usage:
The strategy can be utilized in trending markets, where the Vortex Indicator helps identify trend direction and strength, and the Moving Average smooths the price data to filter out some noise. It aims to capture trends and ride them while avoiding false signals during choppy or sideways markets. กลยุทธ์
AIR Vortex ADXThis project started as an effort to improve the user interface of the hybrid indicator ADX of Vortex, which is, as per the name, a blend of ADX and Vortex Indicator. Plotting both indicators on the same polarity and normalising the vortex, a better interpretation of the interaction between the two is possible, and trend becomes apparent.
Basically, the Vortex provides the bright punch and ADX the continuation of the trend and momentum.
A range mixer has been added to the vortex, comprising both true and interpercentile ranges (see my previous script for a desrciption of interpercentile range). Users can activate and add amounts of each as they see fit.
Finally, there is an RSI filter, the idea of which is to filter out ranging (flat) markets, where no distinct direction is yet emerging. อินดิเคเตอร์

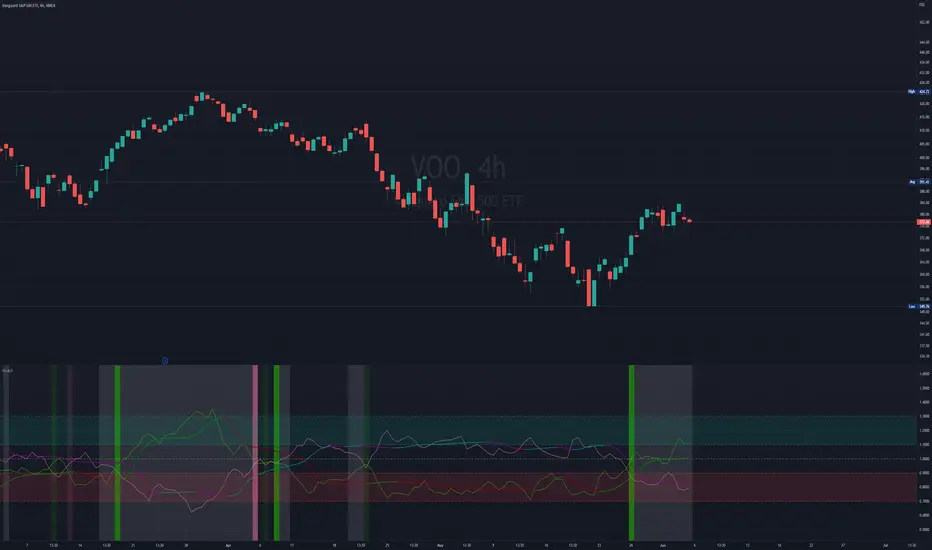
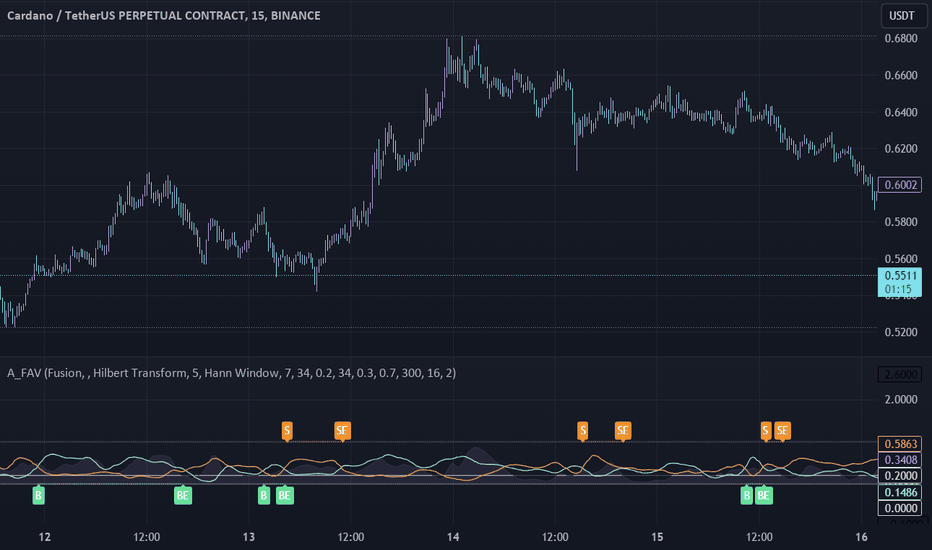
Adaptive Fusion ADX VortexIntroduction
The Adaptive Fusion ADX DI Vortex Indicator is a powerful tool designed to help traders identify trend strength and potential trend reversals in the market. This indicator uses a combination of technical analysis (TA) and mathematical concepts to provide accurate and reliable signals.
Features
The Adaptive Fusion ADX DI Vortex Indicator has several features that make it a powerful tool for traders. The Fusion Mode combines the Vortex Indicator and the ADX DI indicator to provide a more accurate picture of the market. The Hurst Exponent Filter helps to filter out choppy markets (inspired by balipour). Additionally, the indicator can be customized with various inputs and settings to suit individual trading strategies.
Signals
The enterLong signal is generated when the algorithm detects that it's a good time to buy a stock or other asset. This signal is based on certain conditions such as the values of technical indicators like ADX, Vortex, and Fusion. For example, if the ADX value is above a certain threshold and there is a crossover between the plus and minus lines of the ADX indicator, then the algorithm will generate an enterLong signal.
Similarly, the enterShort signal is generated when the algorithm detects that it's a good time to sell a stock or other asset. This signal is also based on certain conditions such as the values of technical indicators like ADX, Vortex, and Fusion. For example, if the ADX value is above a certain threshold and there is a crossunder between the plus and minus lines of the ADX indicator, then the algorithm will generate an enterShort signal.
The exitLong and exitShort signals are generated when the algorithm detects that it's a good time to close a long or short position, respectively. These signals are also based on certain conditions such as the values of technical indicators like ADX, Vortex, and Fusion. For example, if the ADX value crosses above a certain threshold or there is a crossover between the minus and plus lines of the ADX indicator, then the algorithm will generate an exitLong signal.
Usage
Traders can use this indicator in a variety of ways, depending on their trading strategy and style. Short-term traders may use it to identify short-term trends and potential trade opportunities, while long-term traders may use it to identify long-term trends and potential investment opportunities. The indicator can also be used to confirm other technical indicators or trading signals. Personally, I prefer to use it for short-term trades.
Strengths
One of the strengths of the Adaptive Fusion ADX DI Vortex Indicator is its accuracy and reliability. The indicator uses a combination of TA and mathematical concepts to provide accurate and reliable signals, helping traders make informed trading decisions. It is also versatile and can be used in a variety of trading strategies.
Weaknesses
While this indicator has many strengths, it also has some weaknesses. One of the weaknesses is that it can generate false signals in choppy or sideways markets. Additionally, the indicator may lag behind the market, making it less effective in fast-moving markets. That's a reason why I included the Hurst Exponent Filter and special smoothing.
Concepts
The Adaptive ADX DI Vortex Indicator with Fusion Mode and Hurst Filter is based on several key concepts. The Average Directional Index (ADX) is used to measure trend strength, while the Vortex Indicator is used to identify trend reversals. The Hurst Exponent is used to filter out noise and provide a more accurate picture of the market.
In conclusion, the Adaptive Fusion ADX DI Vortex Indicator is a versatile and powerful tool for traders. By combining technical analysis and mathematical concepts, this indicator provides accurate and reliable signals for identifying trend strength and potential trend reversals. While it has some weaknesses, its many strengths and features make it a valuable addition to any trader's toolbox.
---
Credits to:
▪️@cheatcountry – Hann Window Smoohing
▪️@loxx – VHF and T3
▪️@balipour – Hurst Exponent Filter อินดิเคเตอร์
อินดิเคเตอร์

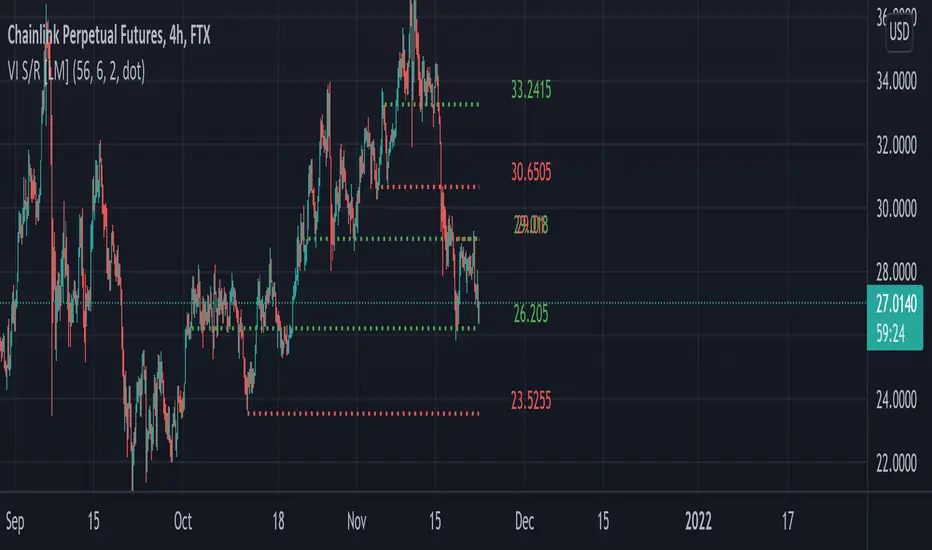
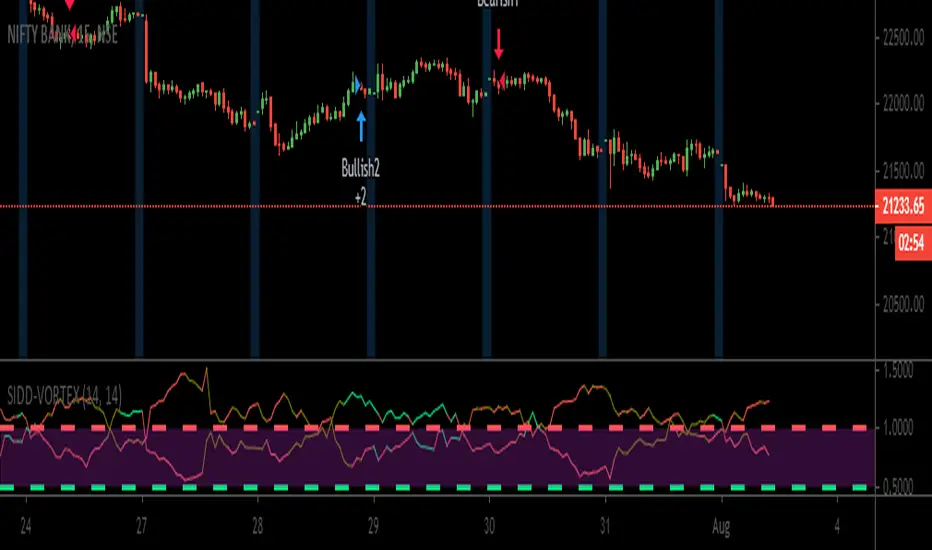
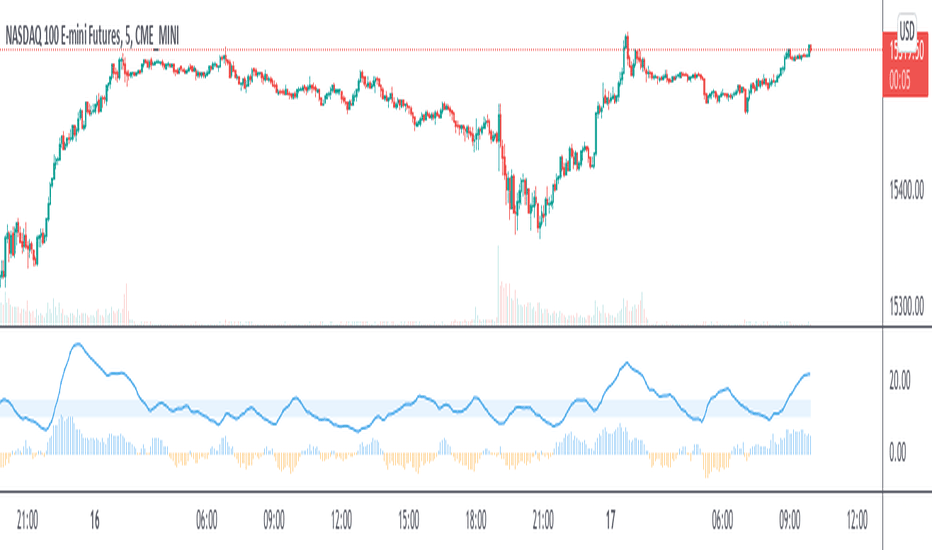
Adaptive Average Vortex Index [lastguru]As a longtime fan of ADX, looking at Vortex Indicator I often wondered, where is the third line. I have rarely seen that anybody is calculating it. So, here it is: Average Vortex Index - an ADX calculated from Vortex Indicator. I interpret it similarly to the ADX indicator: higher values show stronger trend. If you discover other interpretation or have suggestions, comments are welcome.
Both VI+ and VI- lines are also drawn. As I use adaptive length calculation in my other scripts (based on the libraries I've developed and published), I have also included the possibility to have an adaptive length here, so if you hate the idea of calculating ADX from VI, you can disable that line and just look at the adaptive Vortex Indicator.
Note that as with all my oscillators, all the lines here are renormalized to -1..1 range unlike the original Vortex Indicator computation. To do that for VI+ and VI- lines, I subtract 1 from their values. It does not change the shape or the amplitude of the lines.
Adaptation algorithms are roughly subdivided in two categories: classic Length Adaptations and Cycle Estimators (they are also implemented in separate libraries), all are selected in Adaptation dropdown. Length Adaptation used in the Adaptive Moving Averages and the Adaptive Oscillators try to follow price movements and accelerate/decelerate accordingly (usually quite rapidly with a huge range). Cycle Estimators, on the other hand, try to measure the cycle period of the current market, which does not reflect price movement or the rate of change (the rate of change may also differ depending on the cycle phase, but the cycle period itself usually changes slowly).
VIDYA - based on VIDYA algorithm. The period oscillates from the Lower Bound up (slow)
VIDYA-RS - based on Vitali Apirine's modification of VIDYA algorithm (he calls it Relative Strength Moving Average). The period oscillates from the Upper Bound down (fast)
Kaufman Efficiency Scaling - based on Efficiency Ratio calculation originally used in KAMA
Fractal Adaptation - based on FRAMA by John F. Ehlers
MESA MAMA Cycle - based on MESA Adaptive Moving Average by John F. Ehlers
Pearson Autocorrelation* - based on Pearson Autocorrelation Periodogram by John F. Ehlers
DFT Cycle* - based on Discrete Fourier Transform Spectrum estimator by John F. Ehlers
Phase Accumulation* - based on Dominant Cycle from Phase Accumulation by John F. Ehlers
Length Adaptation usually take two parameters: Bound From (lower bound) and To (upper bound). These are the limits for Adaptation values. Note that the Cycle Estimators marked with asterisks(*) are very computationally intensive, so the bounds should not be set much higher than 50, otherwise you may receive a timeout error (also, it does not seem to be a useful thing to do, but you may correct me if I'm wrong).
The Cycle Estimators marked with asterisks(*) also have 3 checkboxes: HP (Highpass Filter), SS (Super Smoother) and HW (Hann Window). These enable or disable their internal prefilters, which are recommended by their author - John F. Ehlers . I do not know, which combination works best, so you can experiment.
If no Adaptation is selected ( None option), you can set Length directly. If an Adaptation is selected, then Cycle multiplier can be set.
The oscillator also has the option to configure the internal smoothing function with Window setting. By default, RMA is used (like in ADX calculation). Fast Default option is using half the length for smoothing. Triangle , Hamming and Hann Window algorithms are some better smoothers suggested by John F. Ehlers.
After the oscillator a Moving Average can be applied. The following Moving Averages are included: SMA , RMA, EMA , HMA , VWMA , 2-pole Super Smoother, 3-pole Super Smoother, Filt11, Triangle Window, Hamming Window, Hann Window, Lowpass, DSSS.
Postfilter options are applied last:
Stochastic - Stochastic
Super Smooth Stochastic - Super Smooth Stochastic (part of MESA Stochastic ) by John F. Ehlers
Inverse Fisher Transform - Inverse Fisher Transform
Noise Elimination Technology - a simplified Kendall correlation algorithm "Noise Elimination Technology" by John F. Ehlers
Momentum - momentum (derivative)
Except for Inverse Fisher Transform , all Postfilter algorithms can have Length parameter. If it is not specified (set to 0), then the calculated Slow MA Length is used. If Filter/MA Length is less than 2 or Postfilter Length is less than 1, they are calculated as a multiplier of the calculated oscillator length.
More information on the algorithms is given in the code for the libraries used. I am also very grateful to other TradingView community members (they are also mentioned in the library code) without whom this script would not have been possible. อินดิเคเตอร์

อินดิเคเตอร์

อินดิเคเตอร์

อินดิเคเตอร์

กลยุทธ์

อินดิเคเตอร์

อินดิเคเตอร์
อินดิเคเตอร์

กลยุทธ์

กลยุทธ์

อินดิเคเตอร์

อินดิเคเตอร์
อินดิเคเตอร์

อินดิเคเตอร์

กลยุทธ์

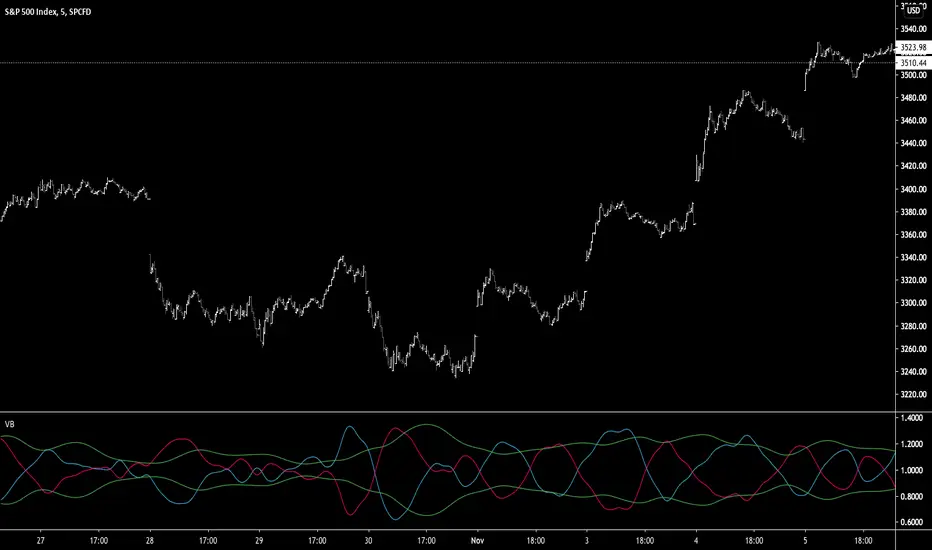
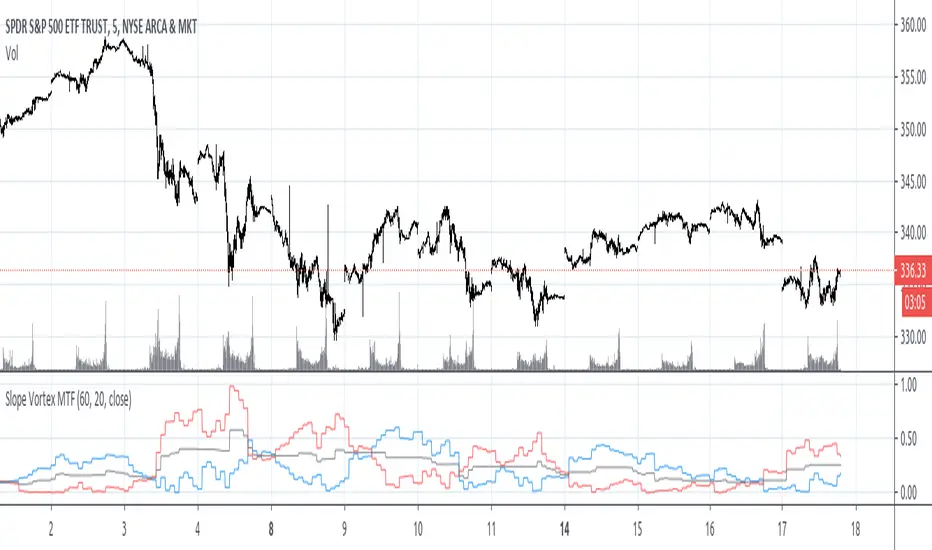
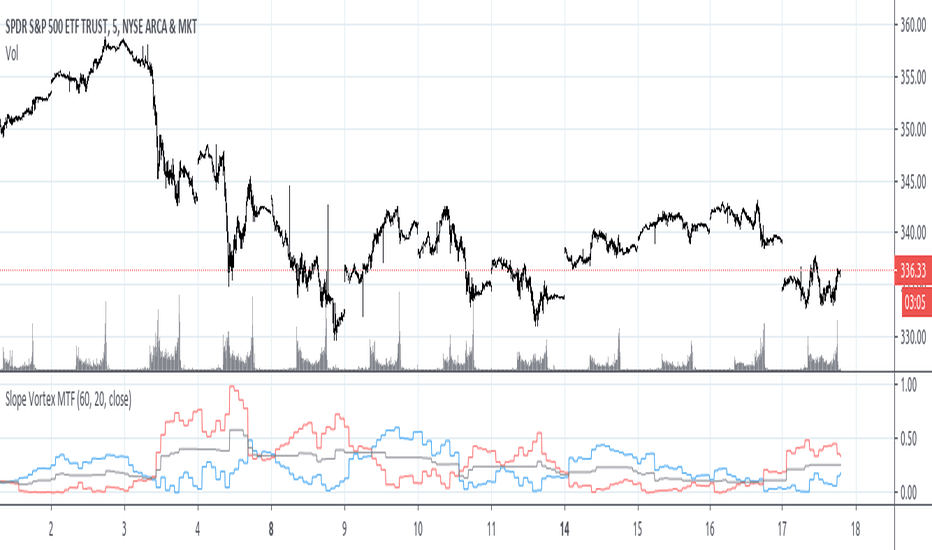
Slope VortexI stumbled upon creating this and thought it was cool and worth sharing. If anyone has ever dabbled with the Aroon or Vortex Indicators, there is some similarity to how it can be used visually.
The indicator basically takes two slopes from the trailing time period you indicate- one from the highest point in that time period, and one from the lowest point. It then plots both.
Here are some of the ways I think this indicator can be used--
Crossover This is the most obvious way, visually. If the blue line crosses under the red, an uptrend has ended or is testing support here. The opposite can be used as well. When the blue line crosses above the red an uptrend is starting or it is testing resistance.
Trending or Ranging If the two bands are moving away from each other/increasing the width between them, there is definite trending action going on. If the two are very narrow or keep crossing each other, whatever symbol you're looking at is likely ranging or consolidating. The black "midpoint" line can also be used to help identify-- if this line is moving up, regardless of if the blue or red band is above, the trend has momentum; if it is going down or flat the previous trend is either slowing greatly or we are ranging.
Support & Resistance Crosses can identify meaningful support and resistance. Having both lines kiss or get very close to the black midpoint line but not cross can also indicate S/R or confirm trend strength.
Here are some snippets of examples I outlined-
I purposely kept this indicator as clean and simple as possible for publication. But I already have tinkered around with taking the output and putting it through the likes of RSI, Stoch, etc. and I think the outcomes are pretty intriguing as well for something so simple. I think dropping the length too much makes it too noisy, so 20, 50, 100 look most useful. อินดิเคเตอร์