 Accelya Solutions India Ltd.Güncellendi
 ACCELYA SOLUTIONS - Another chart for studying stock behavior
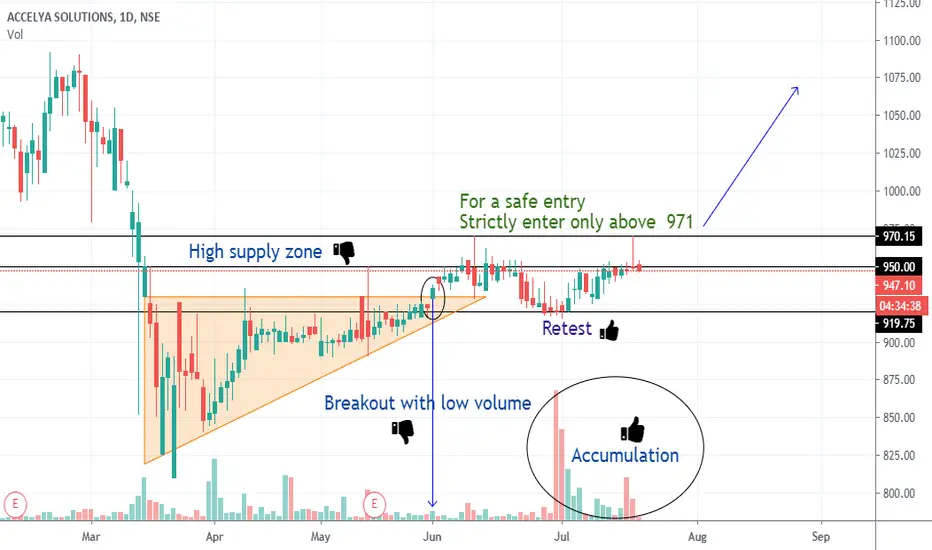
After a breakout from the ascending triangle , there was a weak breakout which wasn't powerful enough to take on the next resistance. A retest of the previous resistance happened which is now a support. Now we see some accumulation going on near the resistance - always a good sign.
A breakout from the current resistance( 950) is expected but the stock will enter the high supply zone of 950-970. Smart traders will make use of this opportunity as well but for investors, it is advisable to enter only above 971.
A breakout from the current resistance( 950) is expected but the stock will enter the high supply zone of 950-970. Smart traders will make use of this opportunity as well but for investors, it is advisable to enter only above 971.
Not
Fundamentally strong:-Virtually debt free
ROE for 3 years - 56.8%
Dividend payout - 66.7%
Stock PE of 12.9% vs Industry PE of 14%
Promoter Holding 75%
Not
Moving just as expected. Keep holding for the rallyNot
Consolidation at this support is healthy for a fresh up move soon.Not
Beautiful rally since the BO. Consolidates and flies.
Feragatname
Bilgiler ve yayınlar, TradingView tarafından sağlanan veya onaylanan finansal, yatırım, alım satım veya diğer türden tavsiye veya öneriler anlamına gelmez ve teşkil etmez. Kullanım Koşulları bölümünde daha fazlasını okuyun.
Feragatname
Bilgiler ve yayınlar, TradingView tarafından sağlanan veya onaylanan finansal, yatırım, alım satım veya diğer türden tavsiye veya öneriler anlamına gelmez ve teşkil etmez. Kullanım Koşulları bölümünde daha fazlasını okuyun.