
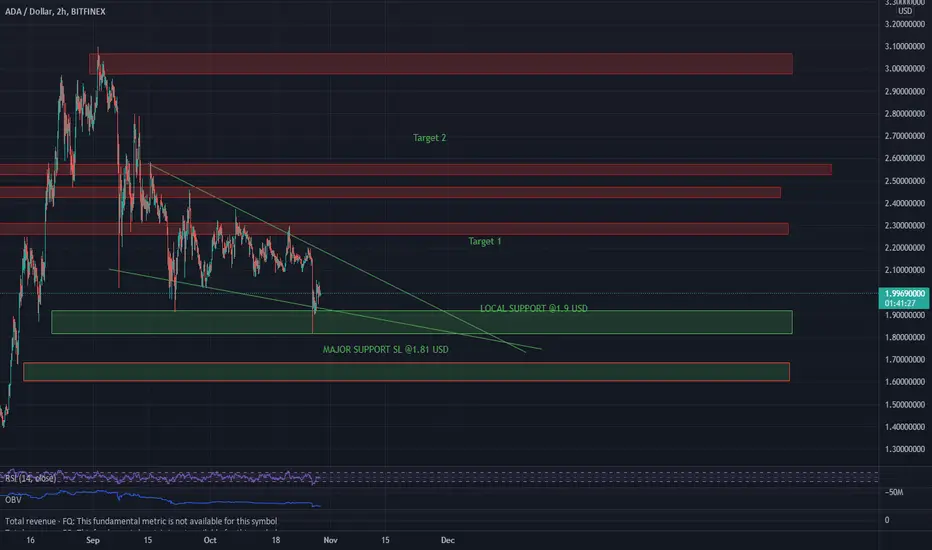
As you can see there is a visible falling wedge pattern on the one day and the 4 hour chart. You can here see the targets for ADA and the support and resistance points. In around 3 days ADA will reach the bottom of the wedge and attempt to breakout (the chances of this are 73.5%). Stop loss - 1.80, Buy between 1.85-1.9
Not
- Not financial advice, just an idea of what may happen
Feragatname
Bilgiler ve yayınlar, TradingView tarafından sağlanan veya onaylanan finansal, yatırım, alım satım veya diğer türden tavsiye veya öneriler anlamına gelmez ve teşkil etmez. Kullanım Koşulları bölümünde daha fazlasını okuyun.
Feragatname
Bilgiler ve yayınlar, TradingView tarafından sağlanan veya onaylanan finansal, yatırım, alım satım veya diğer türden tavsiye veya öneriler anlamına gelmez ve teşkil etmez. Kullanım Koşulları bölümünde daha fazlasını okuyun.