
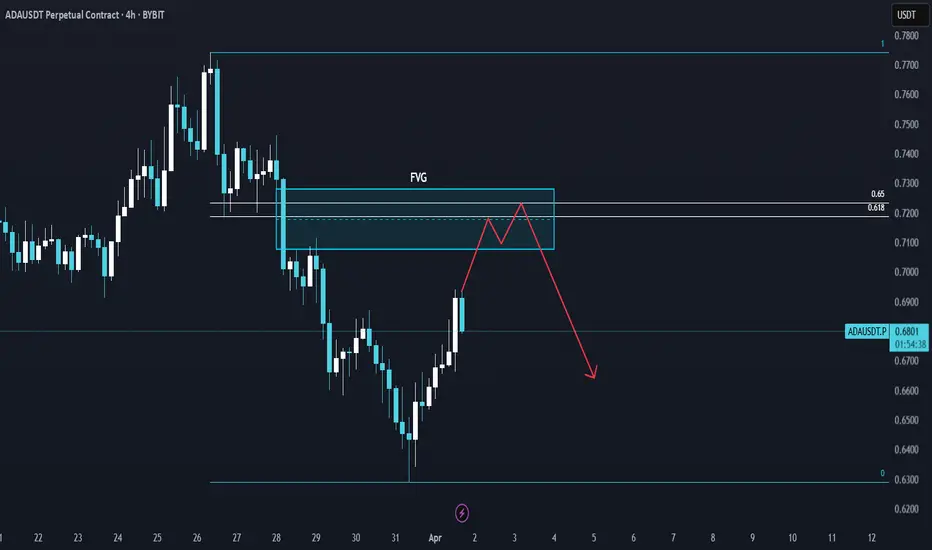
This 4-hour chart of ADA/USDT shows price making a strong recovery after a significant drop. However, it is now approaching a key resistance area—a Fair Value Gap (FVG) near the 0.618-0.65 Fibonacci retracement levels.
Here’s the potential setup:
🔹 FVG Resistance: Price is entering a liquidity zone where sellers might step in.
🔹 Possible Double Top Formation: A rejection at this level could lead to a bearish reversal, forming a distribution pattern before dropping.
🔹 Bearish Continuation? If the FVG acts as resistance, ADA could resume its downtrend, targeting lower support zones.
Will this resistance hold, or will ADA break through and continue higher? Drop your thoughts below! 🔥📉
Here’s the potential setup:
🔹 FVG Resistance: Price is entering a liquidity zone where sellers might step in.
🔹 Possible Double Top Formation: A rejection at this level could lead to a bearish reversal, forming a distribution pattern before dropping.
🔹 Bearish Continuation? If the FVG acts as resistance, ADA could resume its downtrend, targeting lower support zones.
Will this resistance hold, or will ADA break through and continue higher? Drop your thoughts below! 🔥📉
İşlem aktif
Slowly going towards the Fibonacci + FVG?
Feragatname
Bilgiler ve yayınlar, TradingView tarafından sağlanan veya onaylanan finansal, yatırım, alım satım veya diğer türden tavsiye veya öneriler anlamına gelmez ve teşkil etmez. Kullanım Koşulları bölümünde daha fazlasını okuyun.
Feragatname
Bilgiler ve yayınlar, TradingView tarafından sağlanan veya onaylanan finansal, yatırım, alım satım veya diğer türden tavsiye veya öneriler anlamına gelmez ve teşkil etmez. Kullanım Koşulları bölümünde daha fazlasını okuyun.