
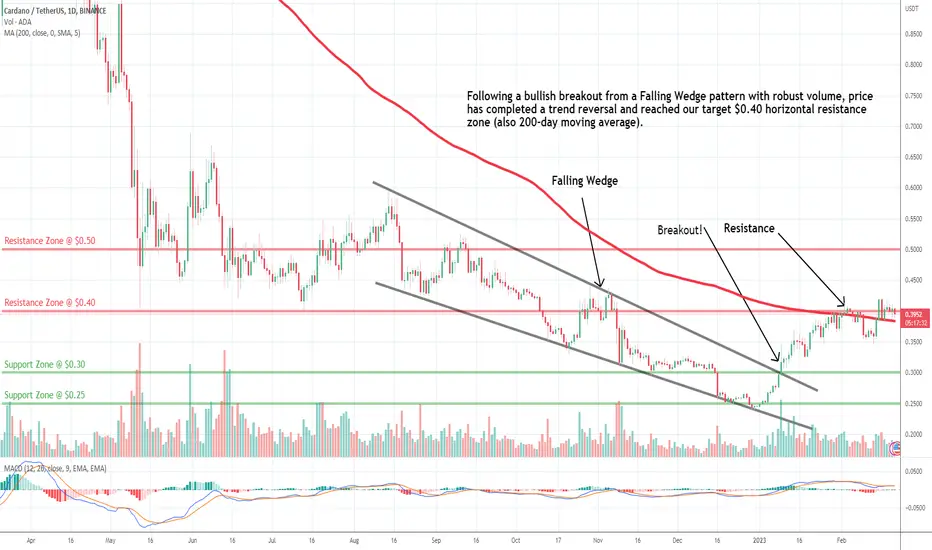
Cardano (ADA) technical analysis:
Trade setup: Following a bullish breakout from Falling Wedge pattern with robust volume, price has completed a trend reversal and reached our target $0.40 horizontal resistance zone (also 200-day moving average). Wait for price to either 1) break above $0.40 to resume uptrend, or 2) pull back near $0.30 support for a swing entry.
Trend: Uptrend across all time horizons (Short- Medium- and Long-Term).
Momentum is Bullish (MACD Line is above MACD Signal Line and RSI is above 55).
Support and Resistance: Nearest Support Zone is $0.30 (previous resistance), then $0.25. The nearest Resistance Zone is $0.40, then $0.50.

Feragatname
Bilgiler ve yayınlar, TradingView tarafından sağlanan veya onaylanan finansal, yatırım, alım satım veya diğer türden tavsiye veya öneriler anlamına gelmez ve teşkil etmez. Kullanım Koşulları bölümünde daha fazlasını okuyun.
Feragatname
Bilgiler ve yayınlar, TradingView tarafından sağlanan veya onaylanan finansal, yatırım, alım satım veya diğer türden tavsiye veya öneriler anlamına gelmez ve teşkil etmez. Kullanım Koşulları bölümünde daha fazlasını okuyun.