
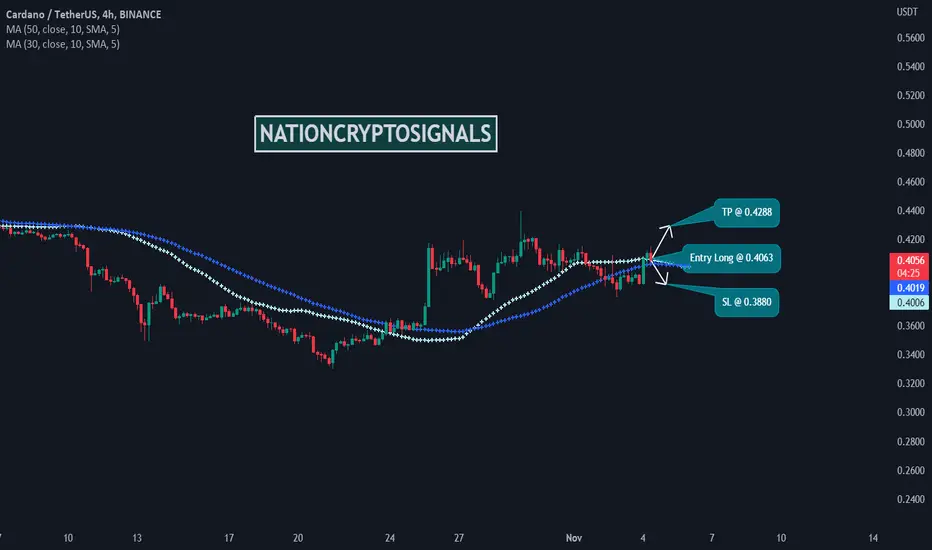
Time Frame: 4H
Symbol: ADAUSDT
Entry: 0.4063
TP: 0.4288
SL: 0.3880
Bias: Long
The study of dynamic support and resistance displays a narrow range and the price is oscillating between two extremes but the volatility factor is low. That is why we cannot expect a high potential trade from the current price context. Considering the price pattern we can expect some price move from support to resistance and resistance to support.

Feragatname
Bilgiler ve yayınlar, TradingView tarafından sağlanan veya onaylanan finansal, yatırım, alım satım veya diğer türden tavsiye veya öneriler anlamına gelmez ve teşkil etmez. Kullanım Koşulları bölümünde daha fazlasını okuyun.
Feragatname
Bilgiler ve yayınlar, TradingView tarafından sağlanan veya onaylanan finansal, yatırım, alım satım veya diğer türden tavsiye veya öneriler anlamına gelmez ve teşkil etmez. Kullanım Koşulları bölümünde daha fazlasını okuyun.