
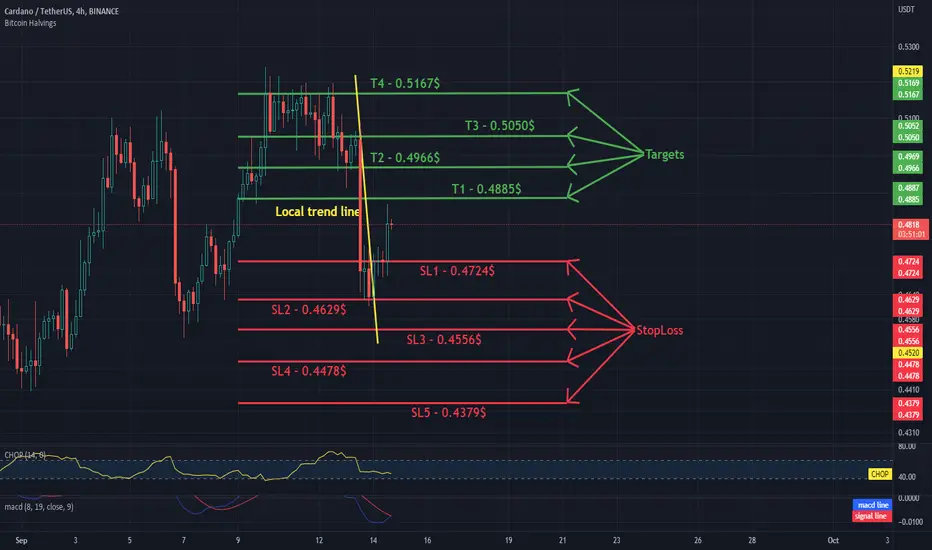
Hello everyone, let's take a look at the 4H ADA to USDT chart as you can see the price is moving above the local downtrend line.
Let's start by setting goals for the near future that we can consider:
T1 - $ 0.4885
T2 - $ 0.4966
T3 - $ 0.5050
and
T4 - $ 0.5167
Now let's move on to the stop loss in case of further market declines:
SL1 - $ 0.4724
SL2 - $ 0.4629
SL3 - $ 0.4556
SL4 - $ 0.4478
and
SL5 - $ 0.4379
Looking at the CHOP indicator, we can see that in the 4H range most of the energy was used, while the MACD indicator shows that the blue line is at the border of the red line crossing from the bottom, which would confirm entering the local upward trend.
Let's start by setting goals for the near future that we can consider:
T1 - $ 0.4885
T2 - $ 0.4966
T3 - $ 0.5050
and
T4 - $ 0.5167
Now let's move on to the stop loss in case of further market declines:
SL1 - $ 0.4724
SL2 - $ 0.4629
SL3 - $ 0.4556
SL4 - $ 0.4478
and
SL5 - $ 0.4379
Looking at the CHOP indicator, we can see that in the 4H range most of the energy was used, while the MACD indicator shows that the blue line is at the border of the red line crossing from the bottom, which would confirm entering the local upward trend.

Feragatname
Bilgiler ve yayınlar, TradingView tarafından sağlanan veya onaylanan finansal, yatırım, alım satım veya diğer türden tavsiye veya öneriler anlamına gelmez ve teşkil etmez. Kullanım Koşulları bölümünde daha fazlasını okuyun.
Feragatname
Bilgiler ve yayınlar, TradingView tarafından sağlanan veya onaylanan finansal, yatırım, alım satım veya diğer türden tavsiye veya öneriler anlamına gelmez ve teşkil etmez. Kullanım Koşulları bölümünde daha fazlasını okuyun.