
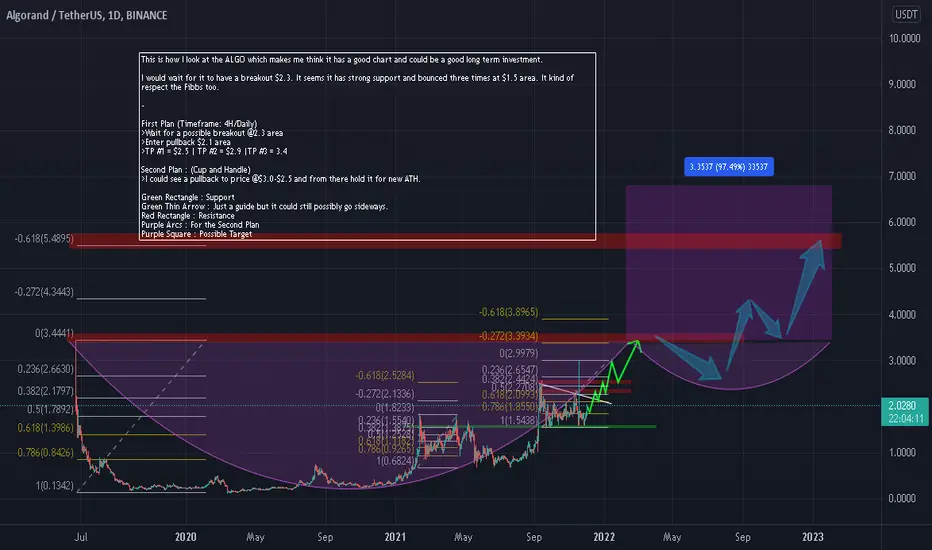
This is how I look at the ALGO which makes me think it has a beautiful chart and could be a good long term investment.
-
First Plan (Timeframe: 4H/Daily)
>Wait for a possible breakout @2.3 area
>Enter pullback $2.1 area
>TP #1 = $2.5 | TP #2 = $2.9 |TP #3 = 3.4
Second Plan : (Cup and Handle)
>I could see a pullback to price @$3.0-$2.5 and from there hold it for new ATH.
Green Rectangle : Support
Green Thin Arrow : Just a guide but it could still possibly go sideways.
Red Rectangle : Resistance
Purple Arcs : For the Second Plan
Purple Square : Possible Target
-
This is just my own opinion that I would possibly follow.
Comment your idea and suggestion that could make this idea so much better and right, thank you!
-
First Plan (Timeframe: 4H/Daily)
>Wait for a possible breakout @2.3 area
>Enter pullback $2.1 area
>TP #1 = $2.5 | TP #2 = $2.9 |TP #3 = 3.4
Second Plan : (Cup and Handle)
>I could see a pullback to price @$3.0-$2.5 and from there hold it for new ATH.
Green Rectangle : Support
Green Thin Arrow : Just a guide but it could still possibly go sideways.
Red Rectangle : Resistance
Purple Arcs : For the Second Plan
Purple Square : Possible Target
-
This is just my own opinion that I would possibly follow.
Comment your idea and suggestion that could make this idea so much better and right, thank you!

Feragatname
Bilgiler ve yayınlar, TradingView tarafından sağlanan veya onaylanan finansal, yatırım, alım satım veya diğer türden tavsiye veya öneriler anlamına gelmez ve teşkil etmez. Kullanım Koşulları bölümünde daha fazlasını okuyun.
Feragatname
Bilgiler ve yayınlar, TradingView tarafından sağlanan veya onaylanan finansal, yatırım, alım satım veya diğer türden tavsiye veya öneriler anlamına gelmez ve teşkil etmez. Kullanım Koşulları bölümünde daha fazlasını okuyun.