
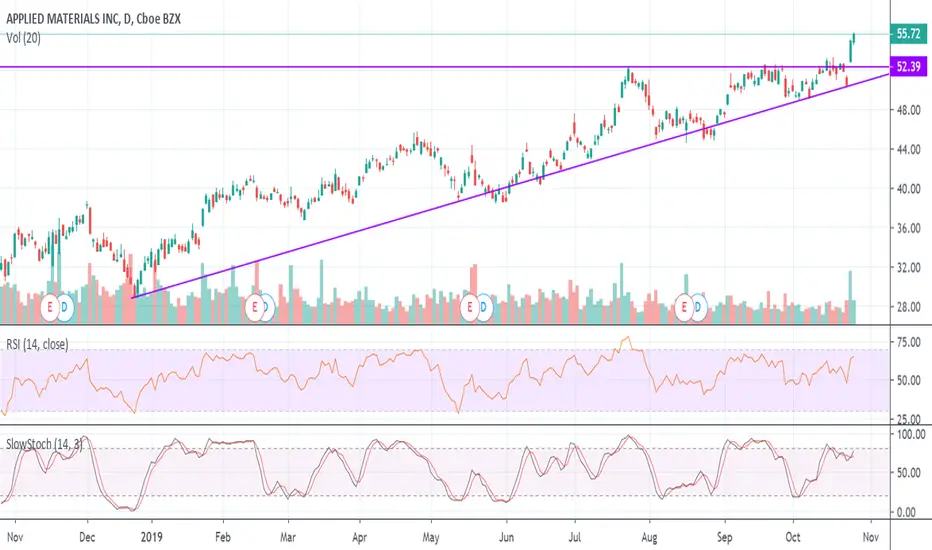
AMAT is a rather standard chart. An Ascending Triangle pattern has formed since the Christmas Eve low with only a couple of instances where the rising support line was broken. Each time the line was broken it was by a small amount & each time the line was regained shortly after. A multiple top pattern dating from late July led to the resistance line across the top of the chart. The breakout happened on October 24th. I am just waiting for the eventual pullback re-test to see if resistance has now become support.
Not
Stock re-tested on Halloween & has continued rising. It is near overbought but got to let them run.
Feragatname
Bilgiler ve yayınlar, TradingView tarafından sağlanan veya onaylanan finansal, yatırım, alım satım veya diğer türden tavsiye veya öneriler anlamına gelmez ve teşkil etmez. Kullanım Koşulları bölümünde daha fazlasını okuyun.
Feragatname
Bilgiler ve yayınlar, TradingView tarafından sağlanan veya onaylanan finansal, yatırım, alım satım veya diğer türden tavsiye veya öneriler anlamına gelmez ve teşkil etmez. Kullanım Koşulları bölümünde daha fazlasını okuyun.