
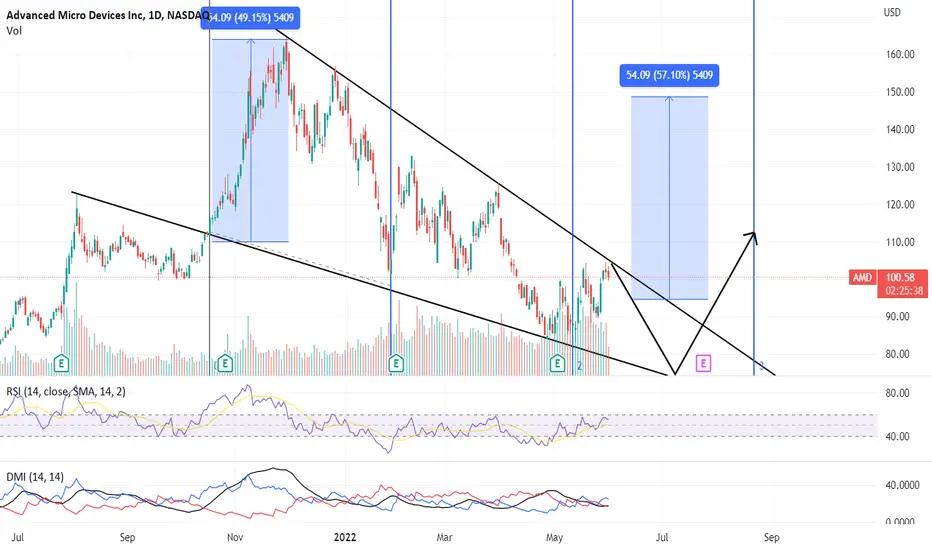
AMD on the daily chart and weekly chart showing a falling wedge pattern. It is also resisting the trendline. It needs to break out of the pattern with high volume is currently missing.
On the fib time cycle, it is in the third phase cycle and will take another month to break the pattern. On unconventional rsi it is resisting and going down it is suitable for shorting now up to 70 odd levels.
Then wait for a swing low around $70 - $75 for entry for a minimum risk to reward ratio. after breaking the pattern it may go up to the $150 level.
Watch out closely.
Cheers and Happy Trading..!!
#Keepitsimple #Tradeeasy
On the fib time cycle, it is in the third phase cycle and will take another month to break the pattern. On unconventional rsi it is resisting and going down it is suitable for shorting now up to 70 odd levels.
Then wait for a swing low around $70 - $75 for entry for a minimum risk to reward ratio. after breaking the pattern it may go up to the $150 level.
Watch out closely.
Cheers and Happy Trading..!!
#Keepitsimple #Tradeeasy

Feragatname
Bilgiler ve yayınlar, TradingView tarafından sağlanan veya onaylanan finansal, yatırım, alım satım veya diğer türden tavsiye veya öneriler anlamına gelmez ve teşkil etmez. Kullanım Koşulları bölümünde daha fazlasını okuyun.
Feragatname
Bilgiler ve yayınlar, TradingView tarafından sağlanan veya onaylanan finansal, yatırım, alım satım veya diğer türden tavsiye veya öneriler anlamına gelmez ve teşkil etmez. Kullanım Koşulları bölümünde daha fazlasını okuyun.