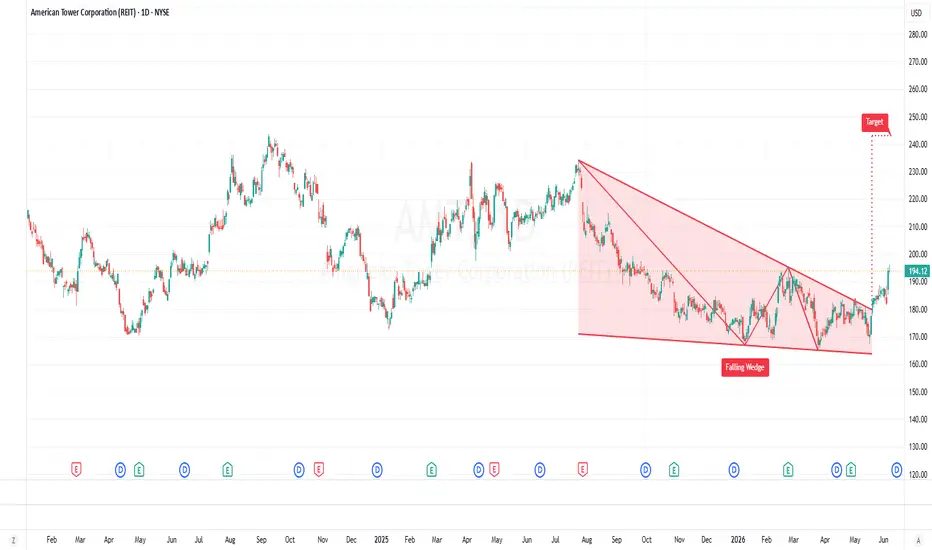
 AMT has successfully broken out of a falling wedge chart pattern on the daily (1D) timeframe, a bullish technical setup that often signals a potential trend reversal and continuation to the upside.
The breakout is supported by an improved price structure, indicating that buyers are regaining control after an extended period of consolidation. As long as the breakout level holds, the stock could continue its upward momentum toward the next key resistance zones.
Profit Targets:
Target 1: $221
Target 2: $243
Traders should monitor volume and price action around these levels for confirmation of continued strength. Follow an appropriate risk management strategy to protect your downside.
#AMT #AmericanTower #StockMarket #TechnicalAnalysis #SwingTrading #BreakoutTrading #ChartPatterns #FallingWedge #StocksToWatch #Investing #TradingIdeas #MarketAnalysis #PriceAction #BullishBreakout #NYSE

Author of the bestseller 'Start Trading Smart' | Founder - Tradewisenet Academy Pvt. Ltd.| Tradewisenet.com
Feragatname
Bilgiler ve yayınlar, TradingView tarafından sağlanan veya onaylanan finansal, yatırım, alım satım veya diğer türden tavsiye veya öneriler anlamına gelmez ve teşkil etmez. Kullanım Koşulları bölümünde daha fazlasını okuyun.
Author of the bestseller 'Start Trading Smart' | Founder - Tradewisenet Academy Pvt. Ltd.| Tradewisenet.com
Feragatname
Bilgiler ve yayınlar, TradingView tarafından sağlanan veya onaylanan finansal, yatırım, alım satım veya diğer türden tavsiye veya öneriler anlamına gelmez ve teşkil etmez. Kullanım Koşulları bölümünde daha fazlasını okuyun.