Amazon ( AMZN) Daily: Testing Institutional 200 EMA Floor – Waiting for Volume Confirmation to Trigger Fib Recovery
### 📦 Amazon.com, Inc. (AMZN) Daily Technical Analysis (Ref: AMZN_2026-06-24_09-10-41.png)
We are releasing a high-confluence structural update on Amazon.com, Inc. (AMZN - NASDAQ) on the Daily (1D) timeframe. The tech giant has completed a deep corrective phase and is currently sitting at a vital long-term institutional junction that could define its macro direction for the upcoming weeks.
The asset concluded its last session printing a tight stabilisation bar, up **+0.57% at 234.11**.
---
### 🔍 The Triple-Layer Support Cluster:
Price action has drifted directly into a heavy, multi-layered technical floor where aggressive institutional defending order blocks are historical present:
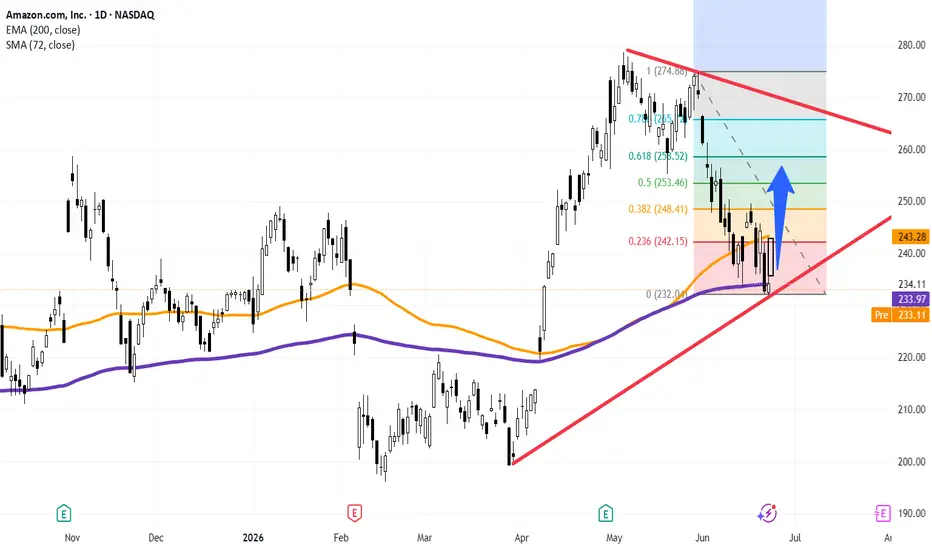
1. **The Institutional Line in the Sand:** The price is actively testing the heavy **200-period EMA (purple line at 233.97)**.
2. **Fibonacci Structural Base:** This dynamic average perfectly aligns with the absolute base (0.0% level) of our recent corrective Fibonacci grid anchoring at **232.04**.
3. **Macro Line of Trend (LTA):** Adding further validity to this cluster, the lower primary ascending trendline (the lower red diagonal line) intersects precisely at this exact node.
---
### 📊 Tactical Playbook: Waiting for Volume & Force Confirmation
While the structural architecture is highly asymmetric for a bullish reversal, our framework demands strict discipline before executing long positions:
* **The Validation Criteria:** We require a definitive **bullish expansion candle backed by above-average volume** during today's trading session (as modeled by our blueprint sketch and blue upward vector). A strong closing signature off the 200 EMA confirms institutional absorption.
* **The Fibonacci Projections:** Once the reversal bar is locked in, the dynamic target matrix shifts toward a structured mean-reversion recovery. The primary mathematical milestones to watch sit at the sequential overhead Fibonacci retracement levels:
* **Target 1:** The 0.236 Fib node at **242.15** (near the overhead 72 SMA at 243.28).
* **Target 2:** The 0.382 Fib node at **248.41**.
* **Target 3:** The 0.50 structural equilibrium node at **253.46**.
### Tactical Summary:
We maintain a high-priority watch onAMZN at the open. Chasing shorts directly into the 200 EMA, the LTA, and the 0 Fib floor yields an incredibly poor risk/reward ratio. We will patiently wait for the daily candle confirmation to trigger asymmetric long setups, keeping initial invalidation stops tightly defined just underneath the 232 structural low.
---
📊 **ChartPro Data**
*Big Tech Architecture, Institutional Moving Average Filters & Systematic Confluence Sourcing.*
⚠️ **Disclaimer:** For educational and informational purposes only. This active market study represents a personal trading framework and does not constitute financial or investment advice.
AMZN) Daily: Testing Institutional 200 EMA Floor – Waiting for Volume Confirmation to Trigger Fib Recovery### 📦 Amazon.com, Inc. (
AMZN) Daily Technical Analysis (Ref: AMZN_2026-06-24_09-10-41.png)We are releasing a high-confluence structural update on Amazon.com, Inc. (
AMZN - NASDAQ) on the Daily (1D) timeframe. The tech giant has completed a deep corrective phase and is currently sitting at a vital long-term institutional junction that could define its macro direction for the upcoming weeks.The asset concluded its last session printing a tight stabilisation bar, up **+0.57% at 234.11**.
---
### 🔍 The Triple-Layer Support Cluster:
Price action has drifted directly into a heavy, multi-layered technical floor where aggressive institutional defending order blocks are historical present:
1. **The Institutional Line in the Sand:** The price is actively testing the heavy **200-period EMA (purple line at 233.97)**.
2. **Fibonacci Structural Base:** This dynamic average perfectly aligns with the absolute base (0.0% level) of our recent corrective Fibonacci grid anchoring at **232.04**.
3. **Macro Line of Trend (LTA):** Adding further validity to this cluster, the lower primary ascending trendline (the lower red diagonal line) intersects precisely at this exact node.
---
### 📊 Tactical Playbook: Waiting for Volume & Force Confirmation
While the structural architecture is highly asymmetric for a bullish reversal, our framework demands strict discipline before executing long positions:
* **The Validation Criteria:** We require a definitive **bullish expansion candle backed by above-average volume** during today's trading session (as modeled by our blueprint sketch and blue upward vector). A strong closing signature off the 200 EMA confirms institutional absorption.
* **The Fibonacci Projections:** Once the reversal bar is locked in, the dynamic target matrix shifts toward a structured mean-reversion recovery. The primary mathematical milestones to watch sit at the sequential overhead Fibonacci retracement levels:
* **Target 1:** The 0.236 Fib node at **242.15** (near the overhead 72 SMA at 243.28).
* **Target 2:** The 0.382 Fib node at **248.41**.
* **Target 3:** The 0.50 structural equilibrium node at **253.46**.
### Tactical Summary:
We maintain a high-priority watch on
AMZN at the open. Chasing shorts directly into the 200 EMA, the LTA, and the 0 Fib floor yields an incredibly poor risk/reward ratio. We will patiently wait for the daily candle confirmation to trigger asymmetric long setups, keeping initial invalidation stops tightly defined just underneath the 232 structural low.---
📊 **ChartPro Data**
*Big Tech Architecture, Institutional Moving Average Filters & Systematic Confluence Sourcing.*
⚠️ **Disclaimer:** For educational and informational purposes only. This active market study represents a personal trading framework and does not constitute financial or investment advice.

Feragatname
Bilgiler ve yayınlar, TradingView tarafından sağlanan veya onaylanan finansal, yatırım, alım satım veya diğer türden tavsiye veya öneriler anlamına gelmez ve teşkil etmez. Kullanım Koşulları bölümünde daha fazlasını okuyun.
Feragatname
Bilgiler ve yayınlar, TradingView tarafından sağlanan veya onaylanan finansal, yatırım, alım satım veya diğer türden tavsiye veya öneriler anlamına gelmez ve teşkil etmez. Kullanım Koşulları bölümünde daha fazlasını okuyun.