
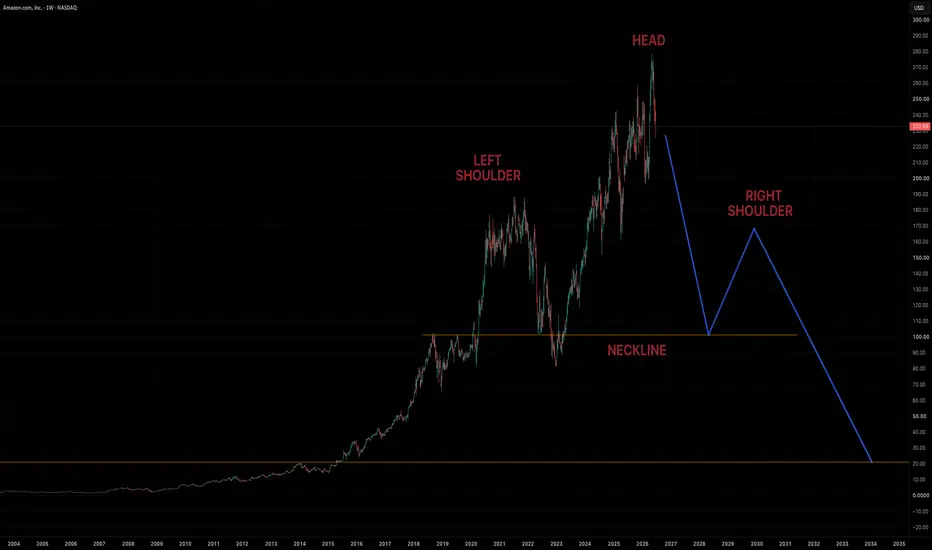
Amazon... potential macro Head & Shoulders pattern setup. This crash is gonna get ugly...
U.S. stock market valuation indicators:
Buffett Indicator: 2026: ~236% (2000 peak: ~145%; 2008 peak: ~110%)
Price-to-Sales: 2026: ~3.6x (2000 peak: ~2.1x; 2008 peak: ~1.5x)
Profit Margins: 2026: ~13.4% (2000 peak: ~8%; 2008 peak: ~7%)
Price-to-Book: 2026: ~5.8x (2000 peak: ~5x; 2008 peak: ~3x)
U.S. stock market valuation indicators:
Buffett Indicator: 2026: ~236% (2000 peak: ~145%; 2008 peak: ~110%)
Price-to-Sales: 2026: ~3.6x (2000 peak: ~2.1x; 2008 peak: ~1.5x)
Profit Margins: 2026: ~13.4% (2000 peak: ~8%; 2008 peak: ~7%)
Price-to-Book: 2026: ~5.8x (2000 peak: ~5x; 2008 peak: ~3x)

Feragatname
Bilgiler ve yayınlar, TradingView tarafından sağlanan veya onaylanan finansal, yatırım, alım satım veya diğer türden tavsiye veya öneriler anlamına gelmez ve teşkil etmez. Kullanım Koşulları bölümünde daha fazlasını okuyun.
Feragatname
Bilgiler ve yayınlar, TradingView tarafından sağlanan veya onaylanan finansal, yatırım, alım satım veya diğer türden tavsiye veya öneriler anlamına gelmez ve teşkil etmez. Kullanım Koşulları bölümünde daha fazlasını okuyun.