
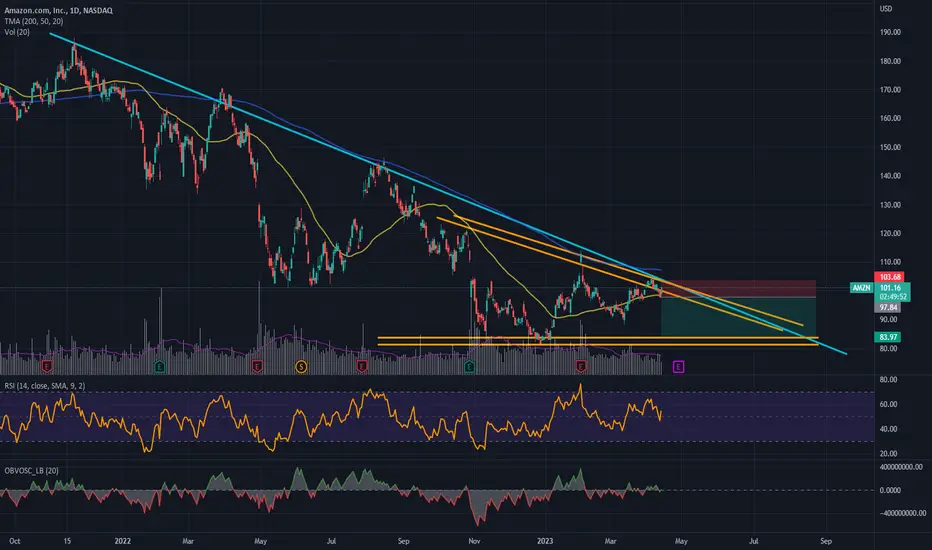
- Price below the 200 MA, confirming the general downtrend.
- Possible formation of descending triangle.
- Demand for the asset is weakening (see volume, RSI and OBV indicators).
When the price cuts below the 50 MA, the RSI is well below 50% and the OBV is red and well below the mid level, enter short. I prefer to enter my positions with confirmations of indicators, rather formations of patterns.
WARNING: THIS IS NOT A INVESTMENT ADVICE. I'M JUST POSTING MY IDEAS AND IT IS FOR EXCHANGE OPINIONS.

Feragatname
Bilgiler ve yayınlar, TradingView tarafından sağlanan veya onaylanan finansal, yatırım, alım satım veya diğer türden tavsiye veya öneriler anlamına gelmez ve teşkil etmez. Kullanım Koşulları bölümünde daha fazlasını okuyun.
Feragatname
Bilgiler ve yayınlar, TradingView tarafından sağlanan veya onaylanan finansal, yatırım, alım satım veya diğer türden tavsiye veya öneriler anlamına gelmez ve teşkil etmez. Kullanım Koşulları bölümünde daha fazlasını okuyun.