
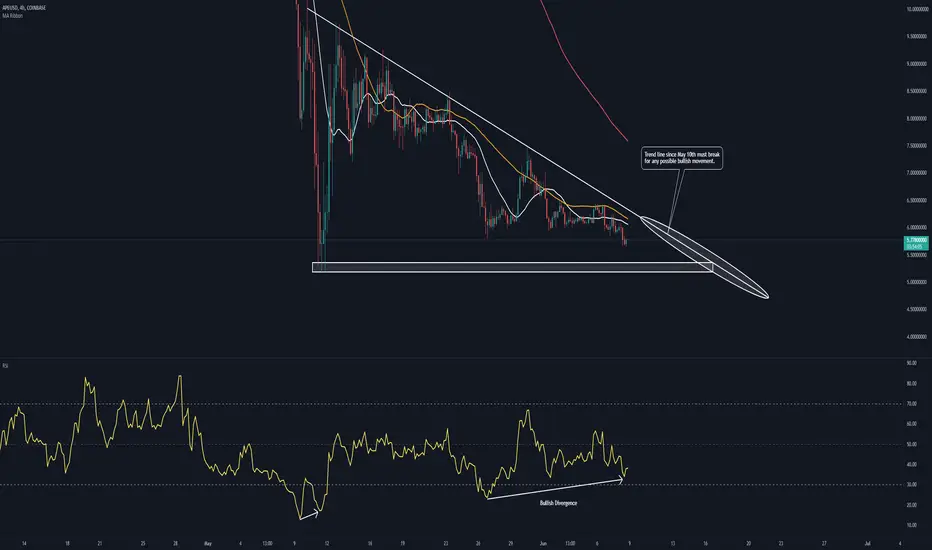
On the 4H chart (and other timeframes), we can see bullish divergence forming where the price action is heading lower and the RSI is making higher lows. This could be a sign of a small reversal coming soon.
Currently, the 4H 50MA (orange line) is acting as resistance, so if we get above that, that would be a good start for a move up.
Support is at $5.20. A break below would invalidate this idea.
Currently, the 4H 50MA (orange line) is acting as resistance, so if we get above that, that would be a good start for a move up.
Support is at $5.20. A break below would invalidate this idea.

Feragatname
Bilgiler ve yayınlar, TradingView tarafından sağlanan veya onaylanan finansal, yatırım, alım satım veya diğer türden tavsiye veya öneriler anlamına gelmez ve teşkil etmez. Kullanım Koşulları bölümünde daha fazlasını okuyun.
Feragatname
Bilgiler ve yayınlar, TradingView tarafından sağlanan veya onaylanan finansal, yatırım, alım satım veya diğer türden tavsiye veya öneriler anlamına gelmez ve teşkil etmez. Kullanım Koşulları bölümünde daha fazlasını okuyun.