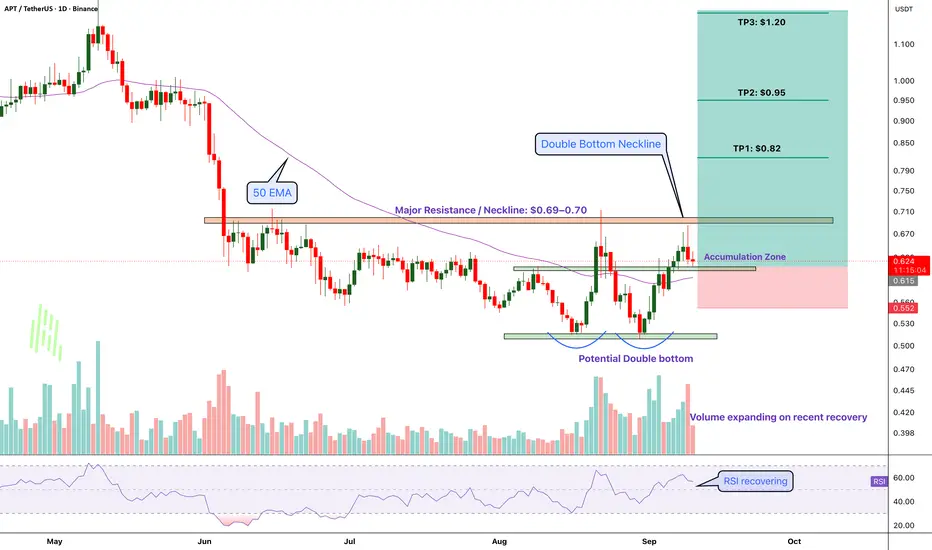

 APTUSDT (
 APTOS) has been pretty much forgotten for a while.After the long sell-off, though, the chart is starting to show a different picture. Price has built a base around the $0.50–$0.52 area and we’re now seeing a recovery back toward the key resistance zone.The level that matters most to me is $0.69–$0.70.That’s the neckline of the potential double bottom. A clean daily break and hold above this area would be the first real confirmation that the bigger trend may be changing.
There are a few things lining up here:
* Potential double bottom around major support
* Price recovering around the 50 EMA
* Volume picking up during the recovery
* RSI turning higher
My levels:
Accumulation: $0.60–$0.63
Invalidation: $0.55
TP1: $0.82
TP2: $0.95
TP3: $1.20
I’m not chasing
 APT here. I’m more interested in what happens around $0.69–$0.70.
Break and hold it → the reversal gets interesting.
Reject it → we may need to wait longer.
Either way, this is one of those charts I’ll be watching closely over the next few weeks.
Follow Our Tradingview Account for More Technical Analysis Updates, | Like, Share and Comment Your thoughts

📢 Telegram Channel: t.me/getgreencrypto
🆓 Free Trial / Contact Us: t.me/greencryptosupport
🌐 Website: greencrypto.net
📚 Docs: docs.greencrypto.net
🆓 Free Trial / Contact Us: t.me/greencryptosupport
🌐 Website: greencrypto.net
📚 Docs: docs.greencrypto.net
İlgili yayınlar
Feragatname
Bilgiler ve yayınlar, TradingView tarafından sağlanan veya onaylanan finansal, yatırım, alım satım veya diğer türden tavsiye veya öneriler anlamına gelmez ve teşkil etmez. Kullanım Koşulları bölümünde daha fazlasını okuyun.
📢 Telegram Channel: t.me/getgreencrypto
🆓 Free Trial / Contact Us: t.me/greencryptosupport
🌐 Website: greencrypto.net
📚 Docs: docs.greencrypto.net
🆓 Free Trial / Contact Us: t.me/greencryptosupport
🌐 Website: greencrypto.net
📚 Docs: docs.greencrypto.net
İlgili yayınlar
Feragatname
Bilgiler ve yayınlar, TradingView tarafından sağlanan veya onaylanan finansal, yatırım, alım satım veya diğer türden tavsiye veya öneriler anlamına gelmez ve teşkil etmez. Kullanım Koşulları bölümünde daha fazlasını okuyun.