
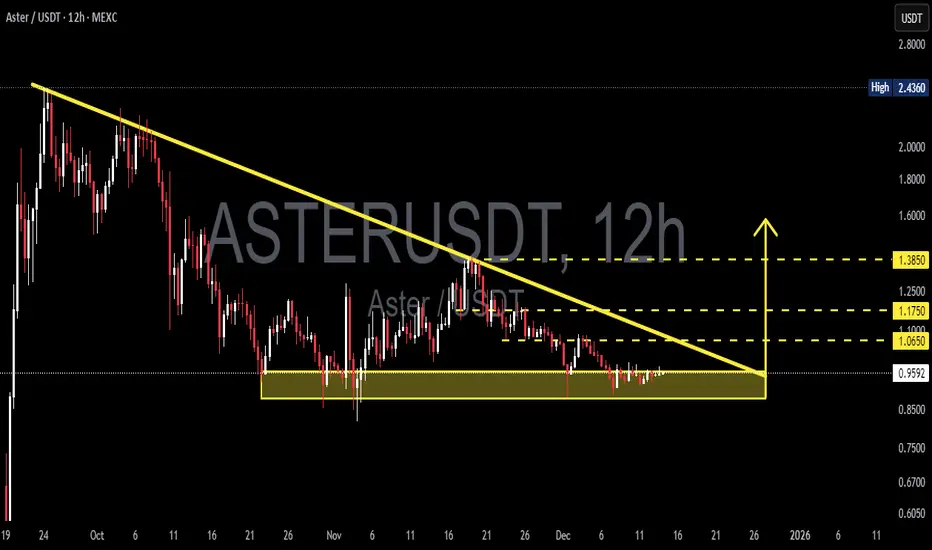
ASTER/USDT is currently trading within a medium-term bearish trend, characterized by a clear sequence of lower highs and lower lows. Price continues to respect a descending trendline, acting as strong dynamic resistance and consistently rejecting bullish attempts.
At the same time, price has reached a major demand zone between 0.96 – 0.88 (yellow box), which has previously served as a strong accumulation area. This zone now represents a decisive battlefield between buyers and sellers.
---
Pattern Explanation
Descending Triangle / Bearish Continuation Structure
Price is forming lower highs beneath a descending trendline, indicating sustained selling pressure.
Horizontal support is well-defined at the 0.96 – 0.88 demand zone.
This structure typically favors a bearish continuation, but a bullish reversal remains possible if demand holds and structure shifts.
Demand Zone (0.96 – 0.88)
This area reflects previous accumulation and strong buyer interest.
Multiple candles show long lower wicks, signaling buying absorption.
A breakdown below this zone would likely trigger accelerated downside momentum.
---
Key Levels
Dynamic Resistance: Descending trendline
Minor Resistance: 1.065
Key Resistance: 1.175
Major Resistance: 1.385
Major Support / Demand: 0.96 – 0.88
---
Bullish Scenario
The bullish scenario remains valid as long as price holds above the 0.96 – 0.88 demand zone.
Bullish confirmation:
Strong bullish reaction from the demand zone
Break and candle close above the descending trendline
Market structure shift from lower highs to higher highs
Potential upside targets:
1.065 (initial resistance)
1.175
1.385 as a continuation target if momentum strengthens
A confirmed breakout above the trendline would signal a potential trend reversal.
---
Bearish Scenario
The bearish scenario becomes dominant if price breaks and closes below 0.88.
Bearish confirmation:
Clear 12H candle close below the demand zone
Failed retest of the 0.88 – 0.96 area
Increasing bearish volume during the breakdown
Downside expectation:
Continuation of the broader downtrend
Price searching for a new lower demand zone
---
Conclusion
ASTER/USDT is currently trading at a critical technical level.
The 0.96 – 0.88 demand zone will determine whether price:
Initiates a bullish reversal, or
Continues its bearish trend with a breakdown
Patience and confirmation are essential — avoid chasing price inside the zone.
---
#ASTERUSDT #CryptoAnalysis #TechnicalAnalysis #Altcoin #Downtrend #DemandZone #SupportResistance #ChartPattern #PriceAction #Breakout #Bearish #Bullish #MarketStructure
At the same time, price has reached a major demand zone between 0.96 – 0.88 (yellow box), which has previously served as a strong accumulation area. This zone now represents a decisive battlefield between buyers and sellers.
---
Pattern Explanation
Descending Triangle / Bearish Continuation Structure
Price is forming lower highs beneath a descending trendline, indicating sustained selling pressure.
Horizontal support is well-defined at the 0.96 – 0.88 demand zone.
This structure typically favors a bearish continuation, but a bullish reversal remains possible if demand holds and structure shifts.
Demand Zone (0.96 – 0.88)
This area reflects previous accumulation and strong buyer interest.
Multiple candles show long lower wicks, signaling buying absorption.
A breakdown below this zone would likely trigger accelerated downside momentum.
---
Key Levels
Dynamic Resistance: Descending trendline
Minor Resistance: 1.065
Key Resistance: 1.175
Major Resistance: 1.385
Major Support / Demand: 0.96 – 0.88
---
Bullish Scenario
The bullish scenario remains valid as long as price holds above the 0.96 – 0.88 demand zone.
Bullish confirmation:
Strong bullish reaction from the demand zone
Break and candle close above the descending trendline
Market structure shift from lower highs to higher highs
Potential upside targets:
1.065 (initial resistance)
1.175
1.385 as a continuation target if momentum strengthens
A confirmed breakout above the trendline would signal a potential trend reversal.
---
Bearish Scenario
The bearish scenario becomes dominant if price breaks and closes below 0.88.
Bearish confirmation:
Clear 12H candle close below the demand zone
Failed retest of the 0.88 – 0.96 area
Increasing bearish volume during the breakdown
Downside expectation:
Continuation of the broader downtrend
Price searching for a new lower demand zone
---
Conclusion
ASTER/USDT is currently trading at a critical technical level.
The 0.96 – 0.88 demand zone will determine whether price:
Initiates a bullish reversal, or
Continues its bearish trend with a breakdown
Patience and confirmation are essential — avoid chasing price inside the zone.
---
#ASTERUSDT #CryptoAnalysis #TechnicalAnalysis #Altcoin #Downtrend #DemandZone #SupportResistance #ChartPattern #PriceAction #Breakout #Bearish #Bullish #MarketStructure

✅ Get Free Signals! Join Our Telegram Channel Here: t.me/TheCryptoNuclear
✅ Twitter: twitter.com/crypto_nuclear
✅ Join Bybit : partner.bybit.com/b/nuclearvip
✅ Benefits : Lifetime Trading Fee Discount -50%
✅ Twitter: twitter.com/crypto_nuclear
✅ Join Bybit : partner.bybit.com/b/nuclearvip
✅ Benefits : Lifetime Trading Fee Discount -50%
Feragatname
Bilgiler ve yayınlar, TradingView tarafından sağlanan veya onaylanan finansal, yatırım, alım satım veya diğer türden tavsiye veya öneriler anlamına gelmez ve teşkil etmez. Kullanım Koşulları bölümünde daha fazlasını okuyun.
✅ Get Free Signals! Join Our Telegram Channel Here: t.me/TheCryptoNuclear
✅ Twitter: twitter.com/crypto_nuclear
✅ Join Bybit : partner.bybit.com/b/nuclearvip
✅ Benefits : Lifetime Trading Fee Discount -50%
✅ Twitter: twitter.com/crypto_nuclear
✅ Join Bybit : partner.bybit.com/b/nuclearvip
✅ Benefits : Lifetime Trading Fee Discount -50%
Feragatname
Bilgiler ve yayınlar, TradingView tarafından sağlanan veya onaylanan finansal, yatırım, alım satım veya diğer türden tavsiye veya öneriler anlamına gelmez ve teşkil etmez. Kullanım Koşulları bölümünde daha fazlasını okuyun.