
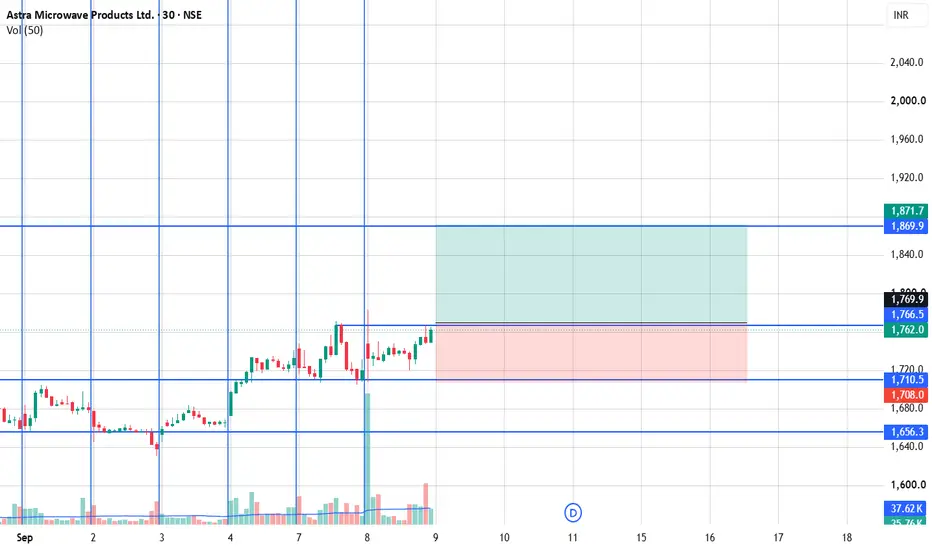
This is Astra Microwave – 30-minute chart. I’ll explain the Buy/Sell setup
Current situation on your chart
Current price is around ₹1,762, so it is sitting between ₹1,710 support and ₹1,870 resistance.
That means the chart is currently in a range, rather than giving a clean breakout/breakdown signal.
Simple rule:
Below ₹1,710 → bearish structure
₹1,710–₹1,870 → range / wait for confirmation
Above ₹1,870 → bullish breakout structure

Feragatname
Bilgiler ve yayınlar, TradingView tarafından sağlanan veya onaylanan finansal, yatırım, alım satım veya diğer türden tavsiye veya öneriler anlamına gelmez ve teşkil etmez. Kullanım Koşulları bölümünde daha fazlasını okuyun.
Feragatname
Bilgiler ve yayınlar, TradingView tarafından sağlanan veya onaylanan finansal, yatırım, alım satım veya diğer türden tavsiye veya öneriler anlamına gelmez ve teşkil etmez. Kullanım Koşulları bölümünde daha fazlasını okuyun.