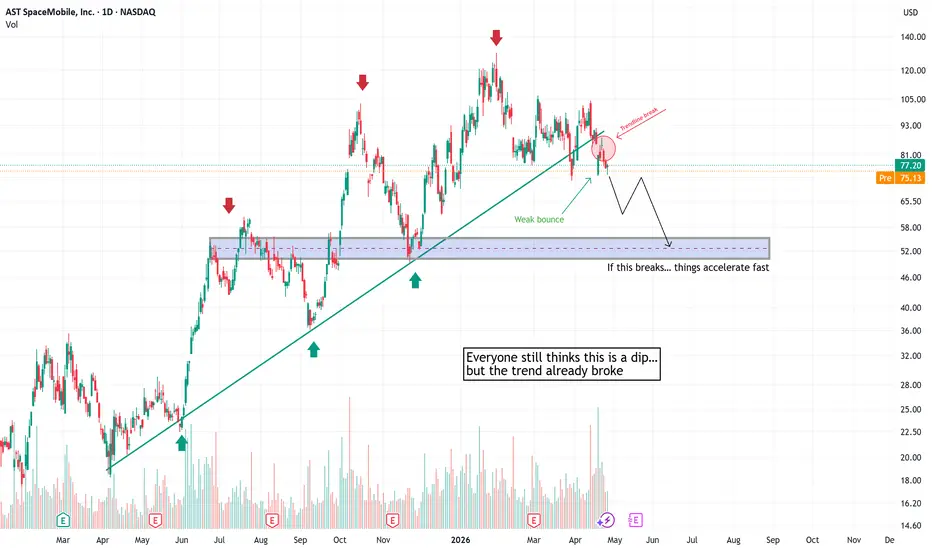
 ASTS built a strong uptrend for months, forming higher highs and higher lows. That structure conditions traders to buy every dip — because it keeps working… until it doesn’t.
Now we’re starting to see early signs of a shift.
The trendline has been broken, and the bounce that followed was weak — not the kind of reaction you expect in a healthy trend.
Trendline break
The first warning sign. It doesn’t confirm a reversal — but it tells you to pay attention.
2. The bounce
This is where you get information:
Strong bounce → trend may continue
Weak bounce → buyers are losing control
In this case: weak bounce
3. Key level test
Price returns to a major level (support/resistance).
This is where the real decision happens.
🎯 WHAT YOU CAN DO
Instead of guessing direction, you can react to levels:
Above 80 → bullish scenario
Structure recovers → potential continuation toward 90–100
Below 75 → bearish scenario
Acceptance below this level → move toward 52–55 becomes likely
👉 You’re not predicting — you’re waiting for confirmation.
WHY THIS MATTERS
Many traders treat this as “just another dip.”
But structurally, this is different:
trend broken
weak bounce
key level under pressure
That’s how trends quietly transition.
The market doesn’t usually tell you when a trend is over…
It shows you —in how price reacts after it breaks.
⚠️ DISCLAIMER
This is not financial advice.
Always manage your risk.

İlgili yayınlar
Feragatname
Bilgiler ve yayınlar, TradingView tarafından sağlanan veya onaylanan finansal, yatırım, alım satım veya diğer türden tavsiye veya öneriler anlamına gelmez ve teşkil etmez. Kullanım Koşulları bölümünde daha fazlasını okuyun.
İlgili yayınlar
Feragatname
Bilgiler ve yayınlar, TradingView tarafından sağlanan veya onaylanan finansal, yatırım, alım satım veya diğer türden tavsiye veya öneriler anlamına gelmez ve teşkil etmez. Kullanım Koşulları bölümünde daha fazlasını okuyun.