
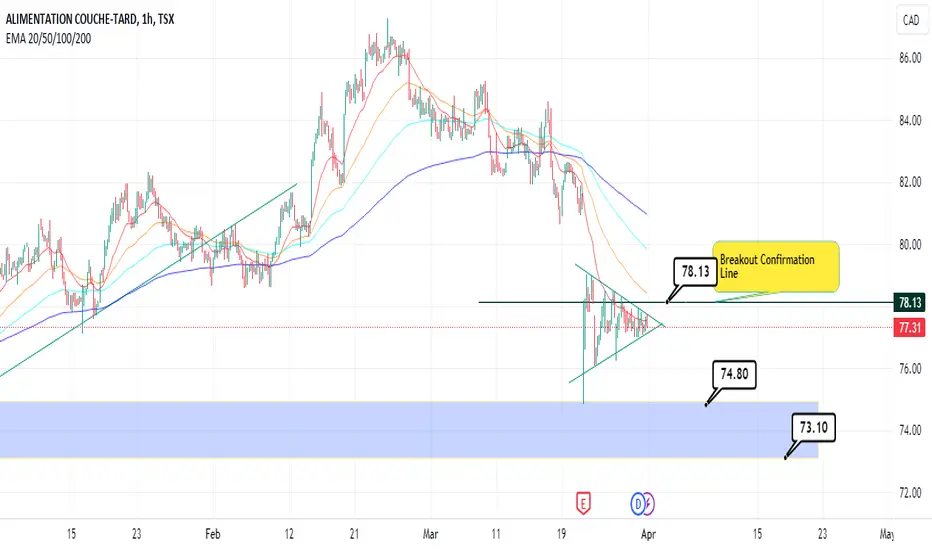
There’s a clear symmetric triangle nearing a breakout and it can go any side as this pattern typically indicates a period of consolidation, with the price breakout direction being uncertain.
In case of a bearish breakout, there’s a strong support zone between $74 and $73. I’d suggest you to wait until the price breaks out above the red EMA 20 line on this hourly chart.
In case of a bearish breakout, there’s a strong support zone between $74 and $73. I’d suggest you to wait until the price breaks out above the red EMA 20 line on this hourly chart.

Feragatname
Bilgiler ve yayınlar, TradingView tarafından sağlanan veya onaylanan finansal, yatırım, alım satım veya diğer türden tavsiye veya öneriler anlamına gelmez ve teşkil etmez. Kullanım Koşulları bölümünde daha fazlasını okuyun.
Feragatname
Bilgiler ve yayınlar, TradingView tarafından sağlanan veya onaylanan finansal, yatırım, alım satım veya diğer türden tavsiye veya öneriler anlamına gelmez ve teşkil etmez. Kullanım Koşulları bölümünde daha fazlasını okuyun.