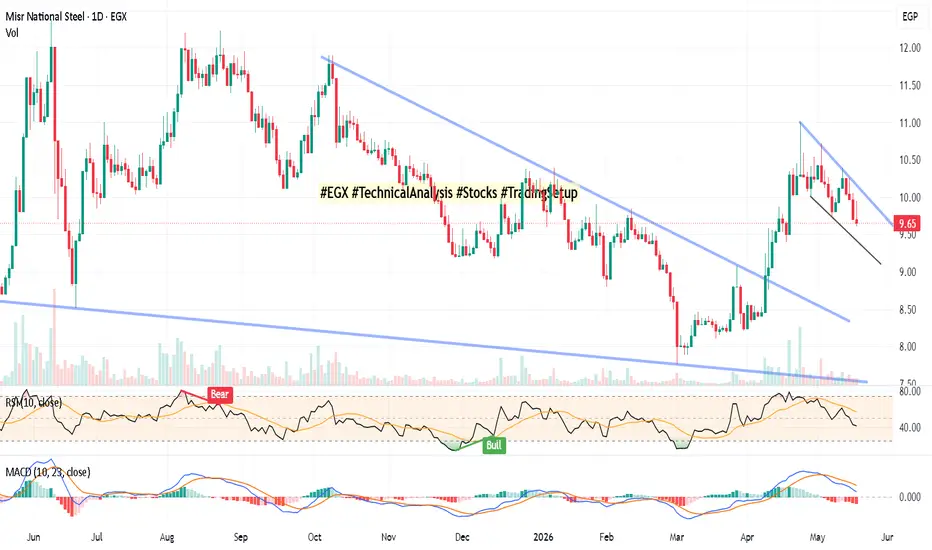
Daily Chart  ATQA
ATQA
On 19 May 2026; Close Price: 9.65
Key Technical Observations
Macro Breakout: ATQA has decisively broken above a massive, year-long descending channel that controlled the price since mid-2025. This shifts the primary trend bias from bearish to bullish.
Bull Flag/Wedge Formation: The current decline from the 11.00 EGP peak is a text-book corrective pullback (Bull Flag), taking place right above the broken macro resistance line.
Volume Confirmation: Volume surged significantly during the April breakout but has completely dried up during this recent drop. This proves the current pullback is low-pressure institutional absorption, not distribution.
Indicators Cooling Down: * RSI (10) has reset from overbought levels down to 41.46, hovering near key structural support (40).
MACD is showing a short-term bearish cross, but crucially remains above the zero line, defending the mid-term bullish regime.
-- Trading Strategy & Levels
The stock is currently sitting at a high-probability "Retest & Bounce" zone, offering an excellent risk-to-reward ratio.
Entry Zone: 9.50 – 9.65 EGP (Look for stabilization or a reversal candle on the daily chart).
Trigger: A daily close above the minor descending flag resistance (approx. 9.85 – 10.00 EGP).
Stop Loss (SL): Daily close below 9.40 EGP (Invalidation of the macro breakout).
Take Profit 1 (TP1): 11.00 EGP (Recent swing high).
Take Profit 2 (TP2): 11.75 – 12.00 EGP (Major long-term ascending purple resistance line).
What is your view on ATQA? Let me know in the comments!
ATQA On 19 May 2026; Close Price: 9.65
Key Technical Observations
Macro Breakout: ATQA has decisively broken above a massive, year-long descending channel that controlled the price since mid-2025. This shifts the primary trend bias from bearish to bullish.
Bull Flag/Wedge Formation: The current decline from the 11.00 EGP peak is a text-book corrective pullback (Bull Flag), taking place right above the broken macro resistance line.
Volume Confirmation: Volume surged significantly during the April breakout but has completely dried up during this recent drop. This proves the current pullback is low-pressure institutional absorption, not distribution.
Indicators Cooling Down: * RSI (10) has reset from overbought levels down to 41.46, hovering near key structural support (40).
MACD is showing a short-term bearish cross, but crucially remains above the zero line, defending the mid-term bullish regime.
-- Trading Strategy & Levels
The stock is currently sitting at a high-probability "Retest & Bounce" zone, offering an excellent risk-to-reward ratio.
Entry Zone: 9.50 – 9.65 EGP (Look for stabilization or a reversal candle on the daily chart).
Trigger: A daily close above the minor descending flag resistance (approx. 9.85 – 10.00 EGP).
Stop Loss (SL): Daily close below 9.40 EGP (Invalidation of the macro breakout).
Take Profit 1 (TP1): 11.00 EGP (Recent swing high).
Take Profit 2 (TP2): 11.75 – 12.00 EGP (Major long-term ascending purple resistance line).
What is your view on ATQA? Let me know in the comments!

Feragatname
Bilgiler ve yayınlar, TradingView tarafından sağlanan veya onaylanan finansal, yatırım, alım satım veya diğer türden tavsiye veya öneriler anlamına gelmez ve teşkil etmez. Kullanım Koşulları bölümünde daha fazlasını okuyun.
Feragatname
Bilgiler ve yayınlar, TradingView tarafından sağlanan veya onaylanan finansal, yatırım, alım satım veya diğer türden tavsiye veya öneriler anlamına gelmez ve teşkil etmez. Kullanım Koşulları bölümünde daha fazlasını okuyun.