

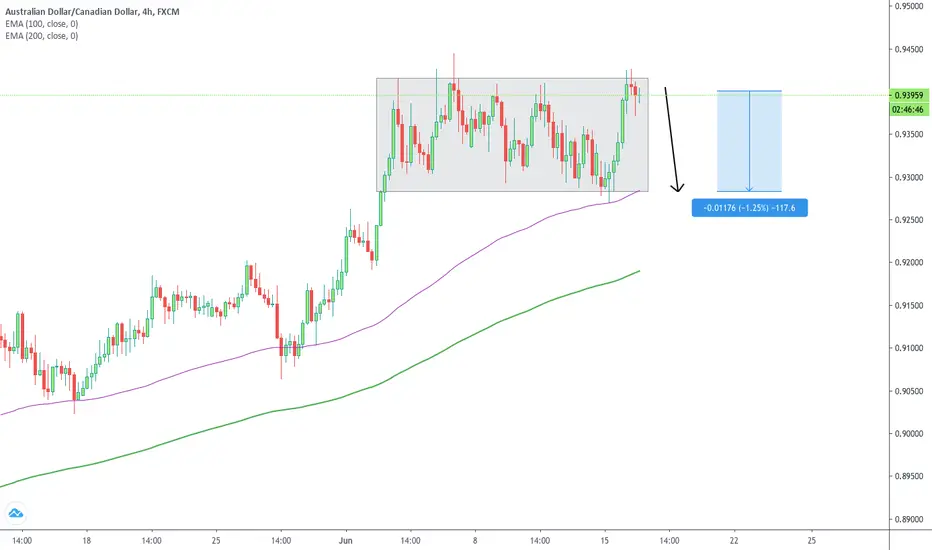
H4 analysis on AUDCAD shows price ranging between the 0.94000 - 0.93000 psychological levels since the beginning of the month.
Price action at the resistance area (long wicks, spinning tops/dojis) indicates price is struggling to break higher.
100+ pip drop potential, targeting the bottom of the range, in line with the 100 EMA where price may reject.
Price action at the resistance area (long wicks, spinning tops/dojis) indicates price is struggling to break higher.
100+ pip drop potential, targeting the bottom of the range, in line with the 100 EMA where price may reject.

Feragatname
Bilgiler ve yayınlar, TradingView tarafından sağlanan veya onaylanan finansal, yatırım, alım satım veya diğer türden tavsiye veya öneriler anlamına gelmez ve teşkil etmez. Kullanım Koşulları bölümünde daha fazlasını okuyun.
Feragatname
Bilgiler ve yayınlar, TradingView tarafından sağlanan veya onaylanan finansal, yatırım, alım satım veya diğer türden tavsiye veya öneriler anlamına gelmez ve teşkil etmez. Kullanım Koşulları bölümünde daha fazlasını okuyun.