

H4 Chart Technical Analysis: Short
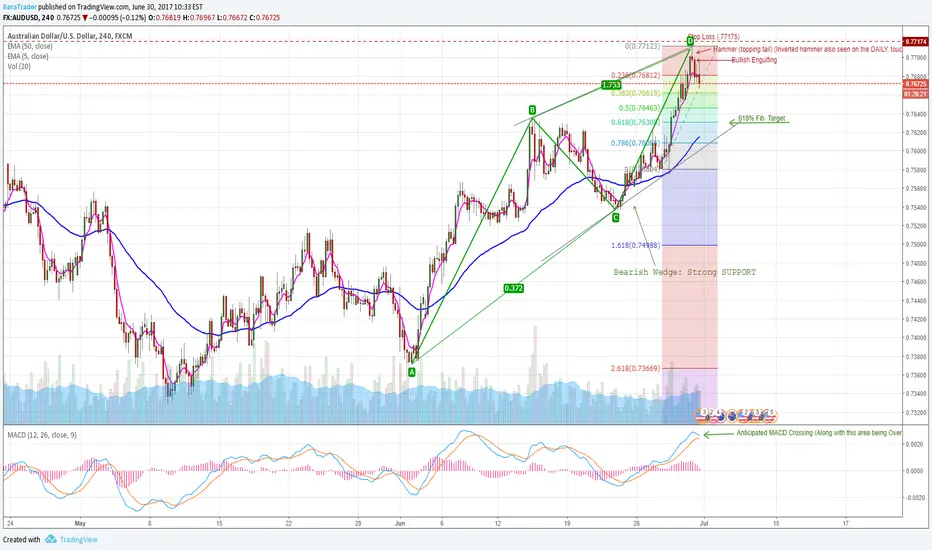
Candlestick analysis of a bullish real body followed by an inverted hammer/topping tail, to a bearish engulfing (of the bullish).
Alongside this we have the MACD's anticipated crossing over and Overbought RSI at the time of the inverted hammer.
My target is not necessarily to 'touch' the bullish trend line of support, but to retrace to the .618% fib. as a correction.
All of this contained within a bearish ABCD pattern.
Thanks Guys,
Kera
Candlestick analysis of a bullish real body followed by an inverted hammer/topping tail, to a bearish engulfing (of the bullish).
Alongside this we have the MACD's anticipated crossing over and Overbought RSI at the time of the inverted hammer.
My target is not necessarily to 'touch' the bullish trend line of support, but to retrace to the .618% fib. as a correction.
All of this contained within a bearish ABCD pattern.
Thanks Guys,
Kera

Feragatname
Bilgiler ve yayınlar, TradingView tarafından sağlanan veya onaylanan finansal, yatırım, alım satım veya diğer türden tavsiye veya öneriler anlamına gelmez ve teşkil etmez. Kullanım Koşulları bölümünde daha fazlasını okuyun.
Feragatname
Bilgiler ve yayınlar, TradingView tarafından sağlanan veya onaylanan finansal, yatırım, alım satım veya diğer türden tavsiye veya öneriler anlamına gelmez ve teşkil etmez. Kullanım Koşulları bölümünde daha fazlasını okuyun.