
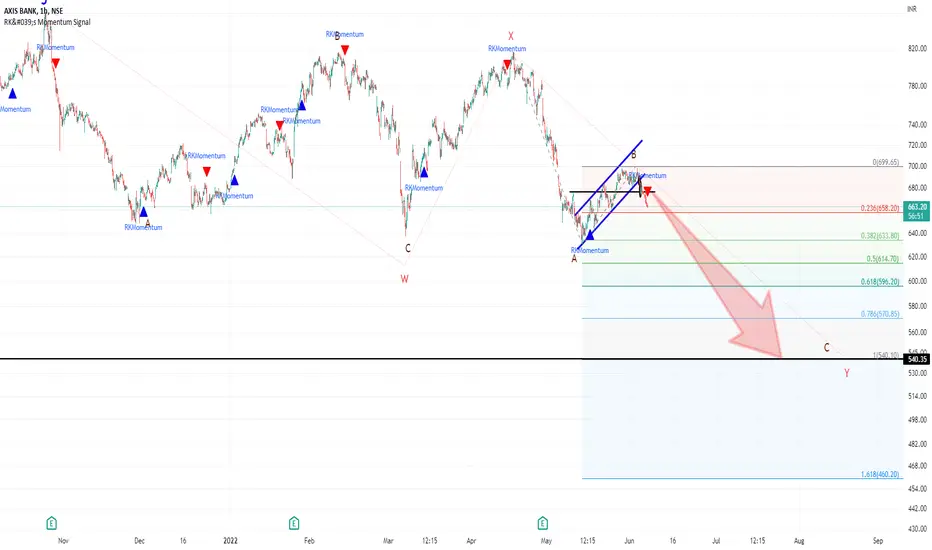
Axisbank has given good breakdown of 20HMA along with bottom of parallel channel in hourly and apart from theses it has also broken support trendline with good intensity of volume.
This stock has fallen below 20DMA which is pegged near 668, Also recent rally ended at RK's Stop line (key level line) near 700.
Overall wave structure is suggesting that corrective phase is going on as a wave W-X-Y, where after completing wave W & X, now wave Y is unfolding as a zig-zag pattern, and in wave Y possibly wave A and B has completed and now wave C is unfolding, If wave C is going to be equal to wave A then we are directed towards south near 540 areas.
significants

Overall wave structure on daily time frame chart

Rejection at RK's stop line along with RK momentum sell activated

RK's momentum is also turning negative crossover in daily chart

macd in hourly running negative

MACD in daily turning/converging Negative below zero line

MACD in weekly running Negative below zero line

RSI in daily down tick and near below 40

RSI in hourly down tick and below 40

Most investors treat trading as a hobby because they have a full-time job doing something else.
However, If you treat trading like a business, it will pay you like a business.
If you treat like a hobby, hobbies don't pay, they cost you...!
Disclaimer.
I am not sebi registered analyst.
My studies are for educational purpose only.
Please Consult your financial advisor before trading or investing.
I am not responsible for any kinds of your profits and your losses.
This stock has fallen below 20DMA which is pegged near 668, Also recent rally ended at RK's Stop line (key level line) near 700.
Overall wave structure is suggesting that corrective phase is going on as a wave W-X-Y, where after completing wave W & X, now wave Y is unfolding as a zig-zag pattern, and in wave Y possibly wave A and B has completed and now wave C is unfolding, If wave C is going to be equal to wave A then we are directed towards south near 540 areas.
significants
Overall wave structure on daily time frame chart
Rejection at RK's stop line along with RK momentum sell activated
RK's momentum is also turning negative crossover in daily chart
macd in hourly running negative
MACD in daily turning/converging Negative below zero line
MACD in weekly running Negative below zero line
RSI in daily down tick and near below 40
RSI in hourly down tick and below 40
Most investors treat trading as a hobby because they have a full-time job doing something else.
However, If you treat trading like a business, it will pay you like a business.
If you treat like a hobby, hobbies don't pay, they cost you...!
Disclaimer.
I am not sebi registered analyst.
My studies are for educational purpose only.
Please Consult your financial advisor before trading or investing.
I am not responsible for any kinds of your profits and your losses.

YouTube: youtube.com/@rk_charts
Telegram : t.me/RK_Charts
Twitter : @charts_rk
Email : rkcharts@gmail. com
Disclaimer.
I am not sebi registered analyst.
My studies are for educational purpose only.
Telegram : t.me/RK_Charts
Twitter : @charts_rk
Email : rkcharts@gmail. com
Disclaimer.
I am not sebi registered analyst.
My studies are for educational purpose only.
İlgili yayınlar
Feragatname
Bilgiler ve yayınlar, TradingView tarafından sağlanan veya onaylanan finansal, yatırım, alım satım veya diğer türden tavsiye veya öneriler anlamına gelmez ve teşkil etmez. Kullanım Koşulları bölümünde daha fazlasını okuyun.