
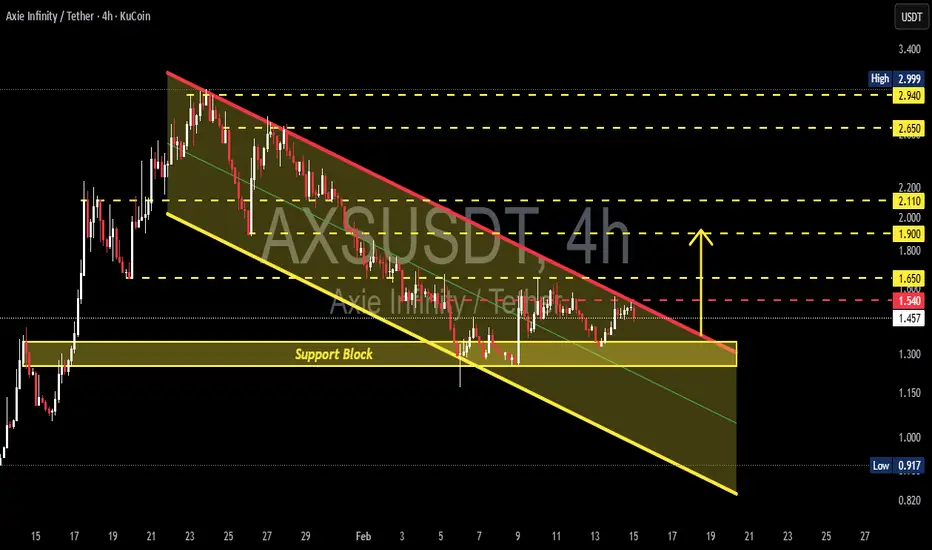
The Axie Infinity / USDT pair on the 4H timeframe is still within a mid-term downtrend structure after failing to hold the supply area around 2.9 – 3.0 USDT.
Price action continues forming consistent Lower Highs (LH) and Lower Lows (LL), indicating strong seller dominance. Currently, price is consolidating right above a crucial support block following rejection from the main trendline resistance.
---
Structure & Pattern Formation
1. Descending Channel / Falling Wedge Hybrid
Two descending trendlines are visible:
Resistance trendline (red) → connecting LHs.
Support trendline (yellow) → holding LLs.
Structure is tightening → indicates volatility compression.
This type of pattern often results in:
Continuation if breakdown occurs.
Reversal if an upside breakout happens.
2. Support Block Demand Zone
The strong demand area is located at:
1.30 – 1.35 USDT
Key confluence factors:
Previous base before impulsive rally.
Multiple wick rejections.
Volume absorption showing buyer defense.
---
Key Levels
Resistance:
1.54 → Minor resistance / latest rejection.
1.65 → Mid-channel resistance.
1.90 → Horizontal resistance.
2.11 → Supply flip area.
2.65 → Major resistance.
2.94 – 3.00 → Macro supply / swing high.
Support:
1.30 – 1.35 → Major support block.
1.15 → Minor channel support.
0.91 → Extreme low / liquidity target.
---
Bullish Scenario
Bullish confirmation requires:
1. Breakout above the red resistance trendline.
2. Strong candle close above 1.54.
3. Successful retest turning resistance into support.
Upside targets:
1.65
1.90
2.11
2.65
2.94
Additional confirmation:
Volume expansion on breakout.
Bullish RSI divergence (if present).
Market structure shift from LH → HH.
Meaning:
Buyers escape channel pressure and initiate a mid-term reversal phase.
---
Bearish Scenario
Bearish continuation activates if:
1. The 1.30 – 1.35 support block breaks.
2. Candle closes below the demand zone.
3. Retest fails to reclaim the area.
Downside targets:
1.15
1.00 psychological level
0.91 (liquidity sweep zone)
A breakdown would confirm a new Lower Low, continuing the downtrend structure.
---
Conclusion
Primary trend: Bearish (mid-term)
Current position: Above key demand
Structure: Descending channel compression
Potential: Reversal on breakout / Dump on support loss
This is a decision zone.
Price reaction between 1.30 – 1.54 will determine whether AXS:
Starts a relief rally.
Or continues distribution lower.
#AXSUSDT #AXSAnalysis #CryptoTechnicalAnalysis #AltcoinSetup #DescendingChannel #SupportResistance #DemandZone #BreakoutSetup #TradingViewAnalysis #CryptoTrading #AltcoinSeason #PriceAction
Price action continues forming consistent Lower Highs (LH) and Lower Lows (LL), indicating strong seller dominance. Currently, price is consolidating right above a crucial support block following rejection from the main trendline resistance.
---
Structure & Pattern Formation
1. Descending Channel / Falling Wedge Hybrid
Two descending trendlines are visible:
Resistance trendline (red) → connecting LHs.
Support trendline (yellow) → holding LLs.
Structure is tightening → indicates volatility compression.
This type of pattern often results in:
Continuation if breakdown occurs.
Reversal if an upside breakout happens.
2. Support Block Demand Zone
The strong demand area is located at:
1.30 – 1.35 USDT
Key confluence factors:
Previous base before impulsive rally.
Multiple wick rejections.
Volume absorption showing buyer defense.
---
Key Levels
Resistance:
1.54 → Minor resistance / latest rejection.
1.65 → Mid-channel resistance.
1.90 → Horizontal resistance.
2.11 → Supply flip area.
2.65 → Major resistance.
2.94 – 3.00 → Macro supply / swing high.
Support:
1.30 – 1.35 → Major support block.
1.15 → Minor channel support.
0.91 → Extreme low / liquidity target.
---
Bullish Scenario
Bullish confirmation requires:
1. Breakout above the red resistance trendline.
2. Strong candle close above 1.54.
3. Successful retest turning resistance into support.
Upside targets:
1.65
1.90
2.11
2.65
2.94
Additional confirmation:
Volume expansion on breakout.
Bullish RSI divergence (if present).
Market structure shift from LH → HH.
Meaning:
Buyers escape channel pressure and initiate a mid-term reversal phase.
---
Bearish Scenario
Bearish continuation activates if:
1. The 1.30 – 1.35 support block breaks.
2. Candle closes below the demand zone.
3. Retest fails to reclaim the area.
Downside targets:
1.15
1.00 psychological level
0.91 (liquidity sweep zone)
A breakdown would confirm a new Lower Low, continuing the downtrend structure.
---
Conclusion
Primary trend: Bearish (mid-term)
Current position: Above key demand
Structure: Descending channel compression
Potential: Reversal on breakout / Dump on support loss
This is a decision zone.
Price reaction between 1.30 – 1.54 will determine whether AXS:
Starts a relief rally.
Or continues distribution lower.
#AXSUSDT #AXSAnalysis #CryptoTechnicalAnalysis #AltcoinSetup #DescendingChannel #SupportResistance #DemandZone #BreakoutSetup #TradingViewAnalysis #CryptoTrading #AltcoinSeason #PriceAction

✅ Get Free Signals! Join Our Telegram Channel Here: t.me/TheCryptoNuclear
✅ Twitter: twitter.com/crypto_nuclear
✅ Join Bybit : partner.bybit.com/b/nuclearvip
✅ Benefits : Lifetime Trading Fee Discount -50%
✅ Twitter: twitter.com/crypto_nuclear
✅ Join Bybit : partner.bybit.com/b/nuclearvip
✅ Benefits : Lifetime Trading Fee Discount -50%
Feragatname
Bilgiler ve yayınlar, TradingView tarafından sağlanan veya onaylanan finansal, yatırım, alım satım veya diğer türden tavsiye veya öneriler anlamına gelmez ve teşkil etmez. Kullanım Koşulları bölümünde daha fazlasını okuyun.
✅ Get Free Signals! Join Our Telegram Channel Here: t.me/TheCryptoNuclear
✅ Twitter: twitter.com/crypto_nuclear
✅ Join Bybit : partner.bybit.com/b/nuclearvip
✅ Benefits : Lifetime Trading Fee Discount -50%
✅ Twitter: twitter.com/crypto_nuclear
✅ Join Bybit : partner.bybit.com/b/nuclearvip
✅ Benefits : Lifetime Trading Fee Discount -50%
Feragatname
Bilgiler ve yayınlar, TradingView tarafından sağlanan veya onaylanan finansal, yatırım, alım satım veya diğer türden tavsiye veya öneriler anlamına gelmez ve teşkil etmez. Kullanım Koşulları bölümünde daha fazlasını okuyun.