
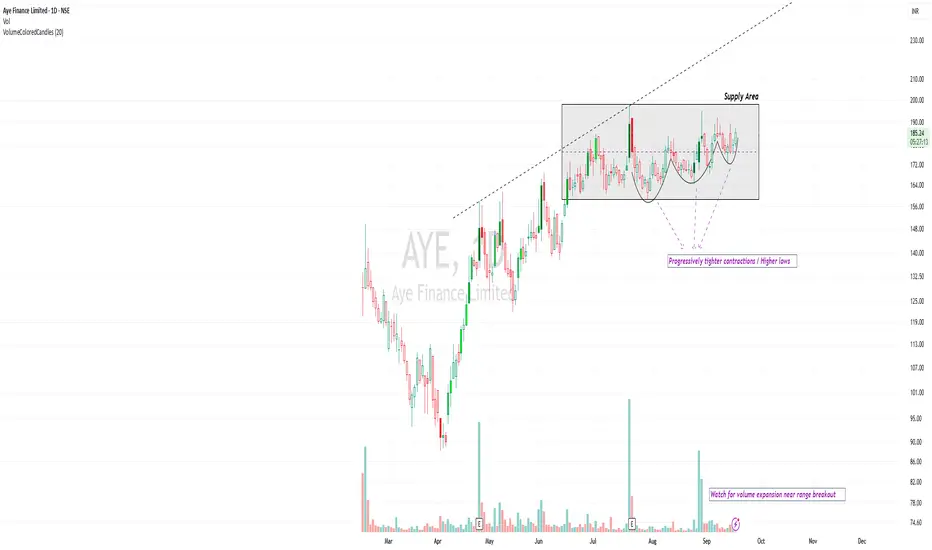
Daily chart | Educational study only
AYE Finance has spent the last several weeks consolidating after a strong advance from the April lows.
At first glance, it looks like a simple sideways range. But the more interesting part is what is happening inside that range.
The structure
The upper end of the base has repeatedly attracted supply, while the lows inside the range have gradually moved higher.
That gives the structure ascending-triangle characteristics: resistance remains broadly in the same area, while buyers appear willing to step in progressively higher on each pullback.
The stock is still inside the base, so there is no confirmed breakout yet. What is interesting is that the structure appears to be getting tighter.
The contraction is the interesting part
The swings inside the base appear to be progressively shrinking.
The first pullback was relatively deep.
The next was shallower.
The latest contraction is tighter again.
That gives the chart VCP-like characteristics.
The basic idea behind volatility contraction is straightforward: as a base matures, aggressive supply can gradually reduce. If fewer holders are willing to sell at progressively lower prices, the swings often become quieter and tighter.
That is what makes this chart worth monitoring.
The rounded contractions
Another interesting feature is the character of the lows.
Instead of repeated sharp V-shaped reversals, several of the pullbacks have developed more gradually and formed rounded contractions.
That suggests orderly consolidation rather than panic liquidation.
It doesn't guarantee a positive resolution, but the character of the pullbacks can be just as important as their direction.
Volume
Volume has generally moderated through much of the consolidation, apart from a few obvious expansion days, including earnings-related activity.
That is broadly constructive for a developing base.
What matters more from here is whether participation expands meaningfully when the range eventually resolves.
Recent average trading activity also does not suggest an extremely illiquid counter, so the tightening cannot simply be dismissed as price becoming quiet because nobody is participating.
Market context matters
The broader market backdrop deserves serious attention here.
The candle from two sessions ago was particularly ugly across multiple indices and sectors. Several sectors slipped below their 50-DMA, breadth deteriorated sharply, and the technical structure of many individual stocks was damaged.
So far, we have not seen meaningful follow-through to that weakness.
But no immediate follow-through does not mean the risk has disappeared. Further selling can still emerge, and damaged breadth often takes time to repair.
That makes this an environment where analysing an individual chart in isolation can be misleading.
Even when a stock-specific setup looks constructive, absolute caution and disciplined risk management are imperative. Position sizing, stop discipline and respect for overall market breadth matter as much as the individual setup.
What I would watch
Not a target.
Not an entry.
Just behaviour.
Does price eventually leave the base with strong participation and hold the move?
Or does it lose the sequence of higher lows and fall back deeper into the range?
Either outcome provides information.
Until then, this remains a developing consolidation with tightening price action near the upper part of the base.
The structure is interesting, but given the current broader-market backdrop, confirmation matters more than anticipation.
Takeaway
The most interesting bases are often the boring ones.
After a strong move, a stock that stops advancing, absorbs supply, forms progressively smaller contractions and continues to hold higher lows deserves attention.
But no stock operates in a vacuum.
The important part is not predicting the breakout. It is watching whether price, volume and the broader market eventually confirm that demand has taken control.
Disclaimer: This post is for educational and chart-study purposes only. It is not investment advice or a recommendation to buy or sell any security. I am not a SEBI-registered Research Analyst or Investment Adviser. Please conduct your own research, manage risk appropriately and consult a SEBI-registered professional before making any investment or trading decision.
AYE Finance has spent the last several weeks consolidating after a strong advance from the April lows.
At first glance, it looks like a simple sideways range. But the more interesting part is what is happening inside that range.
The structure
The upper end of the base has repeatedly attracted supply, while the lows inside the range have gradually moved higher.
That gives the structure ascending-triangle characteristics: resistance remains broadly in the same area, while buyers appear willing to step in progressively higher on each pullback.
The stock is still inside the base, so there is no confirmed breakout yet. What is interesting is that the structure appears to be getting tighter.
The contraction is the interesting part
The swings inside the base appear to be progressively shrinking.
The first pullback was relatively deep.
The next was shallower.
The latest contraction is tighter again.
That gives the chart VCP-like characteristics.
The basic idea behind volatility contraction is straightforward: as a base matures, aggressive supply can gradually reduce. If fewer holders are willing to sell at progressively lower prices, the swings often become quieter and tighter.
That is what makes this chart worth monitoring.
The rounded contractions
Another interesting feature is the character of the lows.
Instead of repeated sharp V-shaped reversals, several of the pullbacks have developed more gradually and formed rounded contractions.
That suggests orderly consolidation rather than panic liquidation.
It doesn't guarantee a positive resolution, but the character of the pullbacks can be just as important as their direction.
Volume
Volume has generally moderated through much of the consolidation, apart from a few obvious expansion days, including earnings-related activity.
That is broadly constructive for a developing base.
What matters more from here is whether participation expands meaningfully when the range eventually resolves.
Recent average trading activity also does not suggest an extremely illiquid counter, so the tightening cannot simply be dismissed as price becoming quiet because nobody is participating.
Market context matters
The broader market backdrop deserves serious attention here.
The candle from two sessions ago was particularly ugly across multiple indices and sectors. Several sectors slipped below their 50-DMA, breadth deteriorated sharply, and the technical structure of many individual stocks was damaged.
So far, we have not seen meaningful follow-through to that weakness.
But no immediate follow-through does not mean the risk has disappeared. Further selling can still emerge, and damaged breadth often takes time to repair.
That makes this an environment where analysing an individual chart in isolation can be misleading.
Even when a stock-specific setup looks constructive, absolute caution and disciplined risk management are imperative. Position sizing, stop discipline and respect for overall market breadth matter as much as the individual setup.
What I would watch
Not a target.
Not an entry.
Just behaviour.
Does price eventually leave the base with strong participation and hold the move?
Or does it lose the sequence of higher lows and fall back deeper into the range?
Either outcome provides information.
Until then, this remains a developing consolidation with tightening price action near the upper part of the base.
The structure is interesting, but given the current broader-market backdrop, confirmation matters more than anticipation.
Takeaway
The most interesting bases are often the boring ones.
After a strong move, a stock that stops advancing, absorbs supply, forms progressively smaller contractions and continues to hold higher lows deserves attention.
But no stock operates in a vacuum.
The important part is not predicting the breakout. It is watching whether price, volume and the broader market eventually confirm that demand has taken control.
Disclaimer: This post is for educational and chart-study purposes only. It is not investment advice or a recommendation to buy or sell any security. I am not a SEBI-registered Research Analyst or Investment Adviser. Please conduct your own research, manage risk appropriately and consult a SEBI-registered professional before making any investment or trading decision.

İlgili yayınlar
Feragatname
Bilgiler ve yayınlar, TradingView tarafından sağlanan veya onaylanan finansal, yatırım, alım satım veya diğer türden tavsiye veya öneriler anlamına gelmez ve teşkil etmez. Kullanım Koşulları bölümünde daha fazlasını okuyun.
İlgili yayınlar
Feragatname
Bilgiler ve yayınlar, TradingView tarafından sağlanan veya onaylanan finansal, yatırım, alım satım veya diğer türden tavsiye veya öneriler anlamına gelmez ve teşkil etmez. Kullanım Koşulları bölümünde daha fazlasını okuyun.