
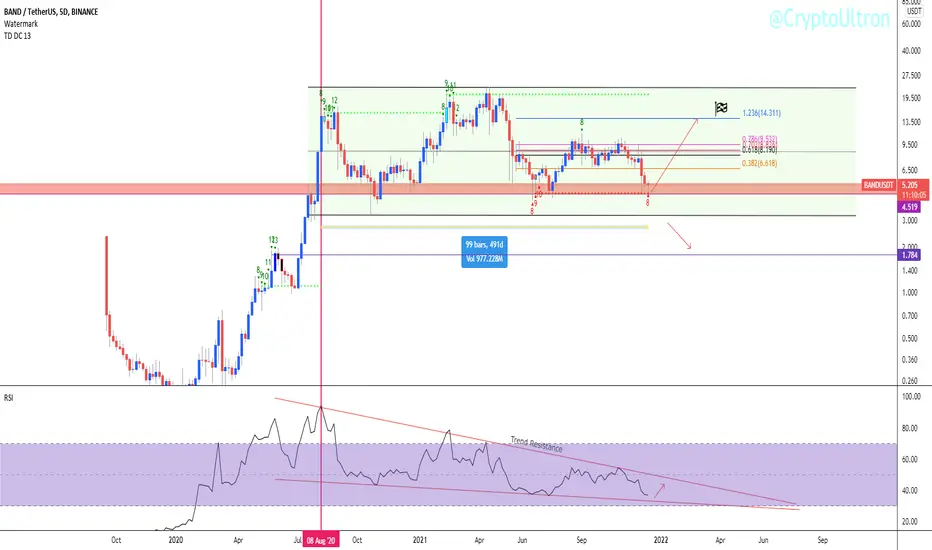
5D chart
BAND has been in the sideway channel for over 490 days in a range between 5$- 22$ while the rsi continues printing lower low. Given the fact that RSI nearly oversold and the price is currently at the bottom of the channel, I would scoop some in the red box on the chart (4.80 -5.10)
Until the RSI downtrend is broken be cautious. Once it breaks expect fireworks.
Invalidation point 4,50
Potential resistance/ target:
5.68 – 6.20 - 6.60 – 7.33
Once this level are cleared other TP on the chart are valid.
If you want maximum gain buy here and #HODL 14$+
BAND has been in the sideway channel for over 490 days in a range between 5$- 22$ while the rsi continues printing lower low. Given the fact that RSI nearly oversold and the price is currently at the bottom of the channel, I would scoop some in the red box on the chart (4.80 -5.10)
Until the RSI downtrend is broken be cautious. Once it breaks expect fireworks.
Invalidation point 4,50
Potential resistance/ target:
5.68 – 6.20 - 6.60 – 7.33
Once this level are cleared other TP on the chart are valid.
If you want maximum gain buy here and #HODL 14$+

Feragatname
Bilgiler ve yayınlar, TradingView tarafından sağlanan veya onaylanan finansal, yatırım, alım satım veya diğer türden tavsiye veya öneriler anlamına gelmez ve teşkil etmez. Kullanım Koşulları bölümünde daha fazlasını okuyun.
Feragatname
Bilgiler ve yayınlar, TradingView tarafından sağlanan veya onaylanan finansal, yatırım, alım satım veya diğer türden tavsiye veya öneriler anlamına gelmez ve teşkil etmez. Kullanım Koşulları bölümünde daha fazlasını okuyun.