
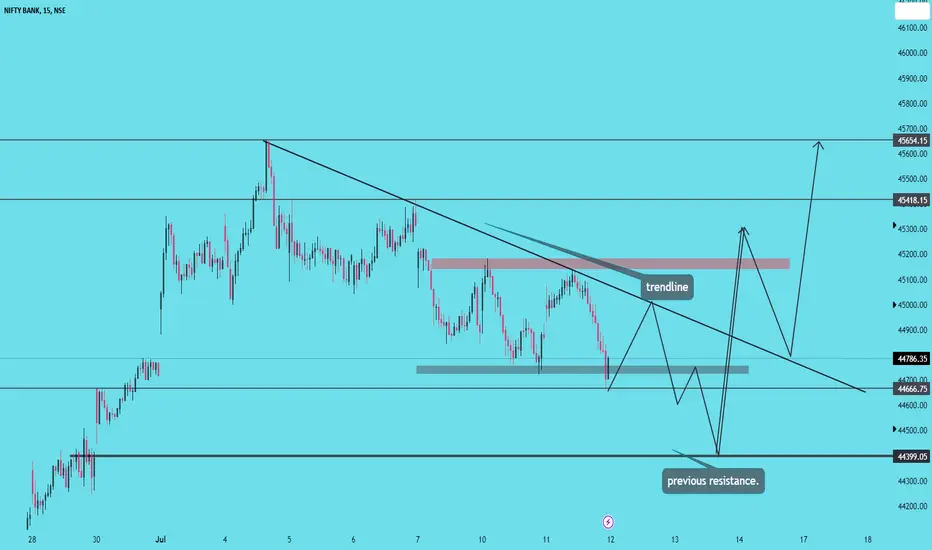
observations::
price again proven that a sign of bearishness....
Price broken our POI for sell,moving slowly to the upside...
broken the trendline..in smaller time frame and fall back...no oppurtunity to enter long...
today we have a major trendline if this trendline again acts as resistance...it will again fall back..
the big red candle is pushing the price little up...
An decending triangle is formed....which is also a sign of bullishness from the previous resistance level...
without knowing we cannot take entry on buy side...
will wait for trendline break and retest....to go long from resistance acts as support.
Not
key levels to watch...if tomorrow price again breaks 45000 level...on retest from above supply will go for buying up to bearish gap.Not
Not
Not
don't enter long..without confirmation....it will test the resistance...that red candle is rejecting...Not
gap may acts as resistance...Not
until don't go for short...price has to break the trendline...and retest...
Not
price created a channel...wait for breakout or breakdown....Not
price is at our POI for sell....Not
Not
if they want to eliminate all sellers...price will test 45000 zone again.Not
going long is tough....after break of trendline and retest..Not
Don't worry those who missed today...will get an opportunity tomorrow.Not
Exit few quantity....İşlem elle kapatılmış

İlgili yayınlar
Feragatname
Bilgiler ve yayınlar, TradingView tarafından sağlanan veya onaylanan finansal, yatırım, alım satım veya diğer türden tavsiye veya öneriler anlamına gelmez ve teşkil etmez. Kullanım Koşulları bölümünde daha fazlasını okuyun.
İlgili yayınlar
Feragatname
Bilgiler ve yayınlar, TradingView tarafından sağlanan veya onaylanan finansal, yatırım, alım satım veya diğer türden tavsiye veya öneriler anlamına gelmez ve teşkil etmez. Kullanım Koşulları bölümünde daha fazlasını okuyun.