
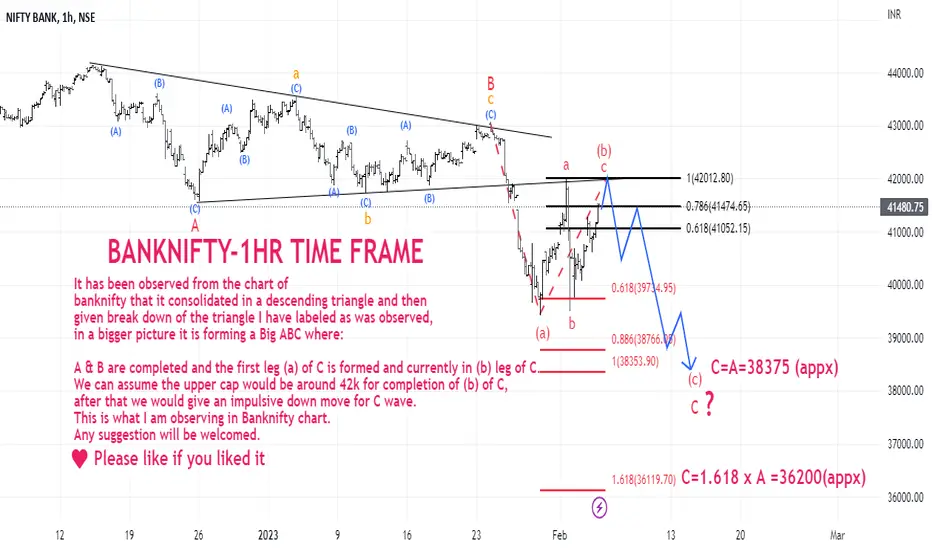
It has been observed from the chart of
banknifty that it consolidated in a descending triangle and then
given break down of the triangle I have labeled as was observed,
in a bigger picture it is forming a Big ABC where:
A & B are completed and the first leg (a) of C is formed and currently in (b) leg of C.
We can assume the upper cap would be around 42k for completion of (b) of C,
after that we would give an impulsive down move for C wave.
This is what I am observing in Banknifty chart.
Any suggestion will be welcomed.
Please like if you liked it
banknifty that it consolidated in a descending triangle and then
given break down of the triangle I have labeled as was observed,
in a bigger picture it is forming a Big ABC where:
A & B are completed and the first leg (a) of C is formed and currently in (b) leg of C.
We can assume the upper cap would be around 42k for completion of (b) of C,
after that we would give an impulsive down move for C wave.
This is what I am observing in Banknifty chart.
Any suggestion will be welcomed.
Please like if you liked it

İlgili yayınlar
Feragatname
Bilgiler ve yayınlar, TradingView tarafından sağlanan veya onaylanan finansal, yatırım, alım satım veya diğer türden tavsiye veya öneriler anlamına gelmez ve teşkil etmez. Kullanım Koşulları bölümünde daha fazlasını okuyun.
İlgili yayınlar
Feragatname
Bilgiler ve yayınlar, TradingView tarafından sağlanan veya onaylanan finansal, yatırım, alım satım veya diğer türden tavsiye veya öneriler anlamına gelmez ve teşkil etmez. Kullanım Koşulları bölümünde daha fazlasını okuyun.