
1. Technical Overview & Structure
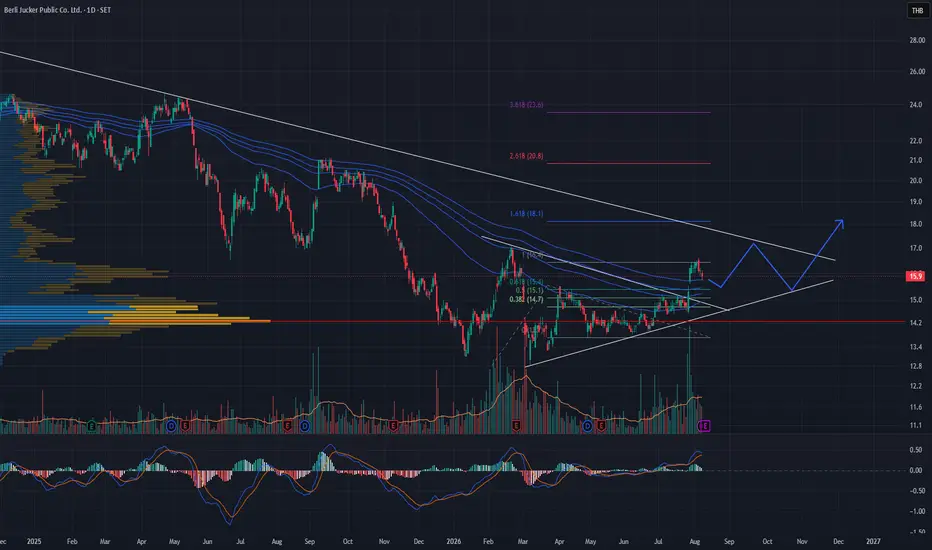
Long-Term Downtrend: The price action remains bound within a broad descending trend channel, capped by a long-term downward resistance line originating from higher highs.
Volume Profile & Accumulation: A substantial concentration of volume (High Volume Nodes) is visible in the lower range around 14.00 – 14.20, forming a solid structural support floor and multi-month accumulation zone.
Converging Pattern (Wedge / Triangle): Price is compressing within a tightening range near key historical support, showing signs of seller exhaustion as it approaches the apex and tests the upper boundary.
2. Key Price Targets (Fibonacci Projections)
Short-Term Target (16.7 – 18.1): Aligned with the 1.0 and 1.618 Fibonacci Extension levels, serving as the initial resistance band upon a successful breakout.
Medium-Term Target (20.8): Corresponds to the 2.618 Fibonacci Extension, which comes into play if bullish momentum expands.
Long-Term Target (23.6+): Aligned with the 3.618 Fibonacci Extension, representing a structural shift back into a major bullish trend phase.
3. Risk Management
Invalidation Level / Stop Loss: A sustained breakdown below the 13.40 – 14.20 support cluster would invalidate the reversal hypothesis, indicating a continuation of the broader structural downtrend.
Long-Term Downtrend: The price action remains bound within a broad descending trend channel, capped by a long-term downward resistance line originating from higher highs.
Volume Profile & Accumulation: A substantial concentration of volume (High Volume Nodes) is visible in the lower range around 14.00 – 14.20, forming a solid structural support floor and multi-month accumulation zone.
Converging Pattern (Wedge / Triangle): Price is compressing within a tightening range near key historical support, showing signs of seller exhaustion as it approaches the apex and tests the upper boundary.
2. Key Price Targets (Fibonacci Projections)
Short-Term Target (16.7 – 18.1): Aligned with the 1.0 and 1.618 Fibonacci Extension levels, serving as the initial resistance band upon a successful breakout.
Medium-Term Target (20.8): Corresponds to the 2.618 Fibonacci Extension, which comes into play if bullish momentum expands.
Long-Term Target (23.6+): Aligned with the 3.618 Fibonacci Extension, representing a structural shift back into a major bullish trend phase.
3. Risk Management
Invalidation Level / Stop Loss: A sustained breakdown below the 13.40 – 14.20 support cluster would invalidate the reversal hypothesis, indicating a continuation of the broader structural downtrend.

Feragatname
Bilgiler ve yayınlar, TradingView tarafından sağlanan veya onaylanan finansal, yatırım, alım satım veya diğer türden tavsiye veya öneriler anlamına gelmez ve teşkil etmez. Kullanım Koşulları bölümünde daha fazlasını okuyun.
Feragatname
Bilgiler ve yayınlar, TradingView tarafından sağlanan veya onaylanan finansal, yatırım, alım satım veya diğer türden tavsiye veya öneriler anlamına gelmez ve teşkil etmez. Kullanım Koşulları bölümünde daha fazlasını okuyun.