
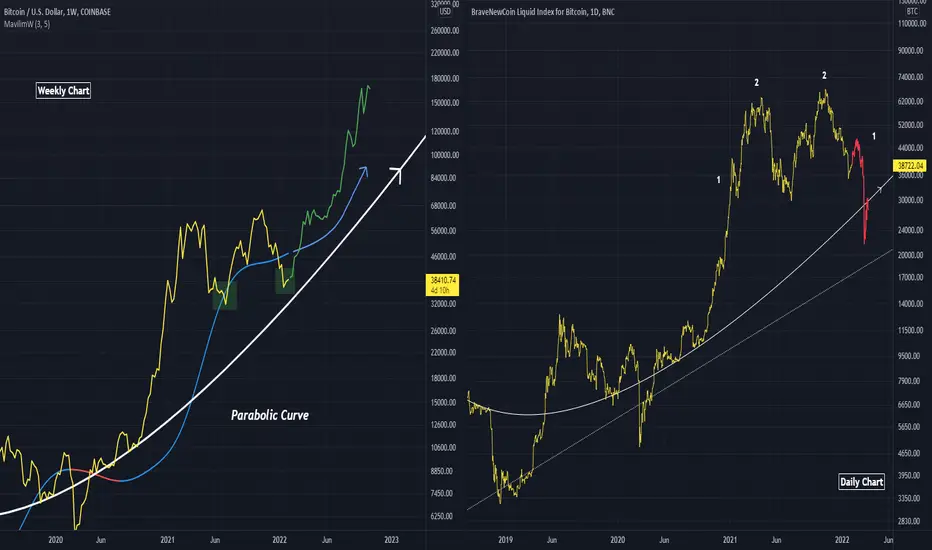
On the left I assume the Parabolic trend hodls, coupled with a double bottom , leading to price increase on the Weekly timeframe
On the right I assume a third breakdown under the same Parabolic trend occurs, as indicated by (1). This provides symmetry for the current formation and allows for the third dip.
Red pill, blue pill
On the right I assume a third breakdown under the same Parabolic trend occurs, as indicated by (1). This provides symmetry for the current formation and allows for the third dip.
Red pill, blue pill
Not
The suggested peak (bars pattern) on the bull chart could just be the initial spike on the (1) move for the bears
Feragatname
Bilgiler ve yayınlar, TradingView tarafından sağlanan veya onaylanan finansal, yatırım, alım satım veya diğer türden tavsiye veya öneriler anlamına gelmez ve teşkil etmez. Kullanım Koşulları bölümünde daha fazlasını okuyun.
Feragatname
Bilgiler ve yayınlar, TradingView tarafından sağlanan veya onaylanan finansal, yatırım, alım satım veya diğer türden tavsiye veya öneriler anlamına gelmez ve teşkil etmez. Kullanım Koşulları bölümünde daha fazlasını okuyun.