
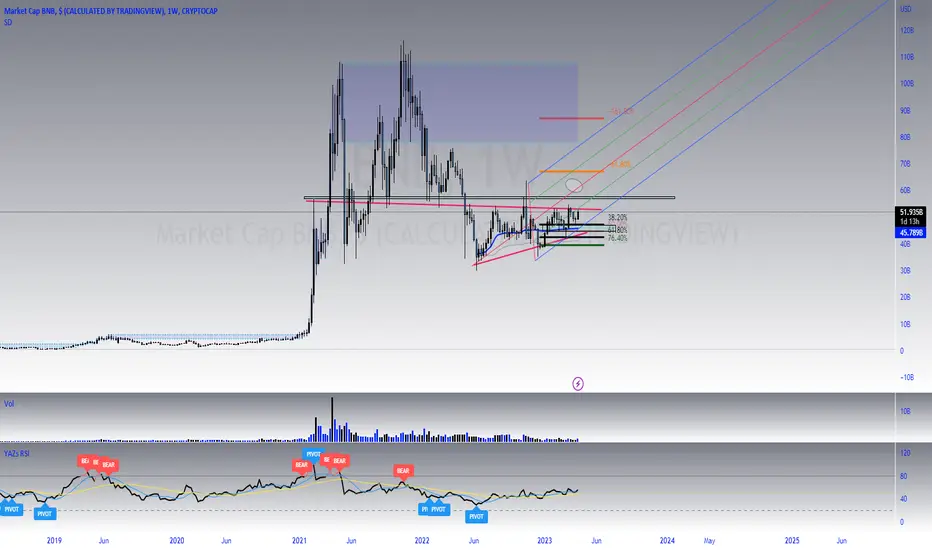
On the chart we can see a symmetrical triangle pattern, which is a neutral pattern meaning that it can breakout either to the upside or to the downside.
Enter the trade once the price breaks out of the triangle.
Look at the volume surge in order to avoid the false breakout.
Targets for long and for short are shown on the chart.
Enter the trade once the price breaks out of the triangle.
Look at the volume surge in order to avoid the false breakout.
Targets for long and for short are shown on the chart.

Feragatname
Bilgiler ve yayınlar, TradingView tarafından sağlanan veya onaylanan finansal, yatırım, alım satım veya diğer türden tavsiye veya öneriler anlamına gelmez ve teşkil etmez. Kullanım Koşulları bölümünde daha fazlasını okuyun.
Feragatname
Bilgiler ve yayınlar, TradingView tarafından sağlanan veya onaylanan finansal, yatırım, alım satım veya diğer türden tavsiye veya öneriler anlamına gelmez ve teşkil etmez. Kullanım Koşulları bölümünde daha fazlasını okuyun.