
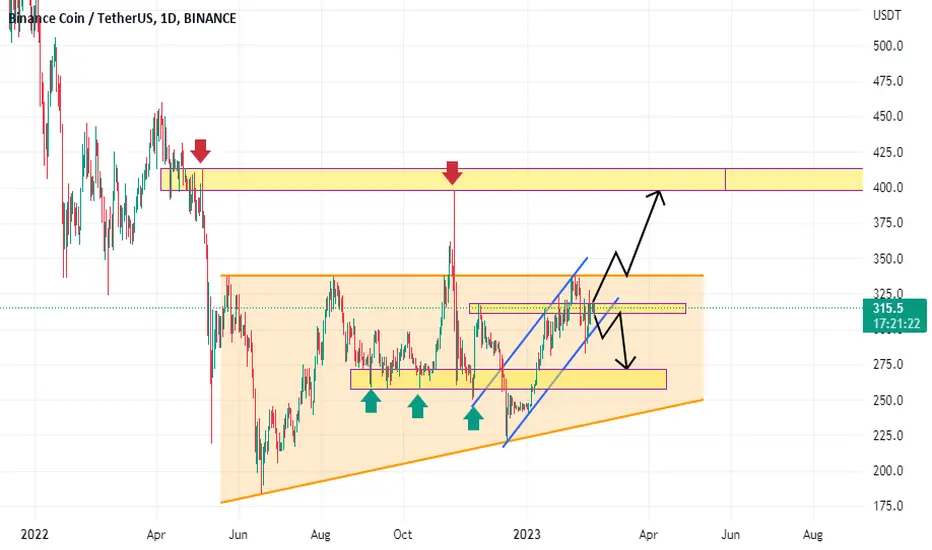
Hello traders, we want to check the BNBUSDT chart on the daily time frame. The price is moving in an ascending channel within a range zone. If the price can maintain its upward trend and break the key level of 340, expect price growth. We have the next target, which is the price of 400. But if it cannot maintain itself in the upward channel and break the channel downward, it will probably drop to around the price of 270. Good luck.

Feragatname
Bilgiler ve yayınlar, TradingView tarafından sağlanan veya onaylanan finansal, yatırım, alım satım veya diğer türden tavsiye veya öneriler anlamına gelmez ve teşkil etmez. Kullanım Koşulları bölümünde daha fazlasını okuyun.
Feragatname
Bilgiler ve yayınlar, TradingView tarafından sağlanan veya onaylanan finansal, yatırım, alım satım veya diğer türden tavsiye veya öneriler anlamına gelmez ve teşkil etmez. Kullanım Koşulları bölümünde daha fazlasını okuyun.