
Good afternoon, friends!
I decided to dig into oil to complete the picture for my ruble forecast. I'm sleepy, so keeping it short today (will add more details later on my page).
Key Points
Storage Levels (Commercial + Strategic Reserves)
China
Reserves as of January 31, 2026: ≈1,095 million barrels (31 days of domestic demand).
Growth from November to January: +26 million barrels. The main buildup occurred in December when imports hit a record 54.6 million tonnes (+17% YoY).
Current utilization of commercial tanker fleets off the coast (Shandong) exceeds 80% of design capacity — no signs of storage shortage.
India
Operating SPR capacity (Visakhapatnam, Mangalore, Padur): 39.1 million barrels.
Fill level as of January 31, 2026: ~33 million barrels (≈84%). Over three months, an additional 3 million barrels were purchased using budget funds allocated in February 2025.
Commercial inventories at refineries remain at a comfortable level of ≈26 days of processing; growth is logistically constrained (Jamnagar port loaded >95%).
Demand Takeaway
China has built up reserves, but levels remain below the administrative target (35 days). This creates a window for sustained high imports, especially at discounts. India is near its SPR ceiling; further purchases depend on storage expansion (Chambala-2 project, 2027).
Reference: Top 10 Oil Importers (2024)
China — 11.1 mb/d India — 5.2 mb/d USA — 5.0 mb/d (imports heavy crude for blending) Japan — 2.8 mb/d South Korea — 2.7 mb/d Germany — 1.9 mb/d Netherlands — 1.8 mb/d (Rotterdam — EU's "gateway") Italy — 1.5 mb/d Spain — 1.3 mb/d Singapore — 1.2 mb/d
OPEC+ Decisions and Market Impact (Updated January 2026)
November 30, 2025 (35th Ministerial Meeting)
Decision: Extend voluntary group cuts of 2.2 mb/d through Q1 2026. Effective period: January 1 – March 31, 2026.
March 3, 2026 (Expected)
In-person meeting in Riyadh. Will consider gradual unwinding of voluntary cuts starting Q2 2026, contingent on "sustained demand growth and declining OECD commercial inventories."
Why Specifically Until March 31, 2026?
Seasonal demand: Q1 is traditionally weaker for consumption; extending cuts helps prevent inventory buildup.
Market uncertainty: January–February brought EU recession risks and Suez Canal logistics disruptions.
Tengiz incident: The 0.45 mb/d reduction from Kazakhstan further tightens the balance, prompting OPEC+ to "play it safe" and maintain discipline.
Price Expectations
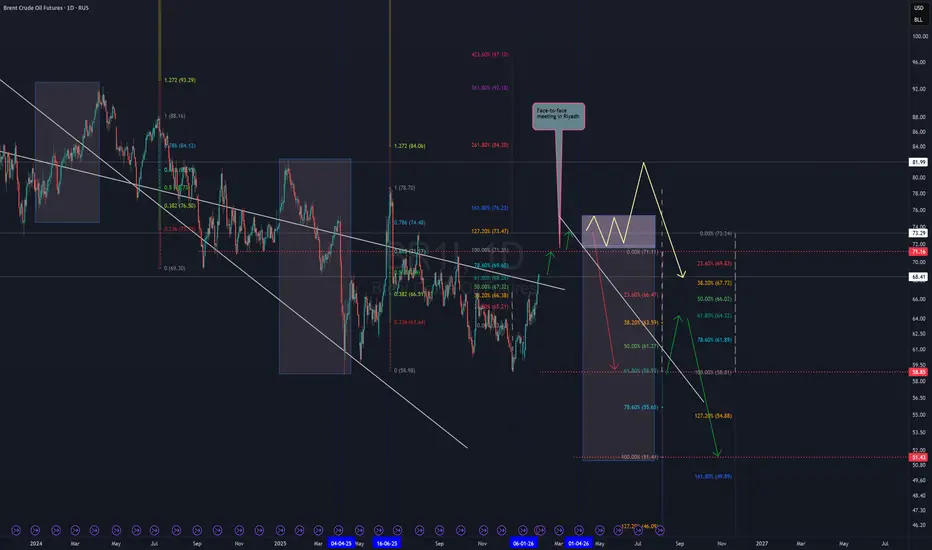
Confident bullish bias amid OPEC production cuts leading up to the next meeting.
Key level and first target: 73.30 USD
Scenario A: Cuts Unwound on March 3
Price returns to 59 USD Followed by a correction to 64 USD (China restocks at a discount) Further decline to 52 USD possible — I lean toward this scenario
Scenario B: Cuts Extended for Another Quarter
Sideways movement: 72–76 USD Potential spike to 80–81 USD Then retracement to 68.50 USD
Why I Consider Scenario B Unlikely
The weighted-average discount on Russian barrels vs. Brent is ≈12 USD/barrel; during congestion or rising freight rates, it temporarily widens to 14–15 USD.
Meaningful damage to the Russian economy only occurs when oil revenues fall below 70 USD.
Sanctions are designed to keep oil prices within a range that is painful for Russia. Therefore, prices will absolutely not be allowed above 82 USD.
In other words, to maintain sanctions effectiveness during the conflict, the logical approach is to cap prices at 74 USD.
I decided to dig into oil to complete the picture for my ruble forecast. I'm sleepy, so keeping it short today (will add more details later on my page).
Key Points
Storage Levels (Commercial + Strategic Reserves)
China
Reserves as of January 31, 2026: ≈1,095 million barrels (31 days of domestic demand).
Growth from November to January: +26 million barrels. The main buildup occurred in December when imports hit a record 54.6 million tonnes (+17% YoY).
Current utilization of commercial tanker fleets off the coast (Shandong) exceeds 80% of design capacity — no signs of storage shortage.
India
Operating SPR capacity (Visakhapatnam, Mangalore, Padur): 39.1 million barrels.
Fill level as of January 31, 2026: ~33 million barrels (≈84%). Over three months, an additional 3 million barrels were purchased using budget funds allocated in February 2025.
Commercial inventories at refineries remain at a comfortable level of ≈26 days of processing; growth is logistically constrained (Jamnagar port loaded >95%).
Demand Takeaway
China has built up reserves, but levels remain below the administrative target (35 days). This creates a window for sustained high imports, especially at discounts. India is near its SPR ceiling; further purchases depend on storage expansion (Chambala-2 project, 2027).
Reference: Top 10 Oil Importers (2024)
China — 11.1 mb/d India — 5.2 mb/d USA — 5.0 mb/d (imports heavy crude for blending) Japan — 2.8 mb/d South Korea — 2.7 mb/d Germany — 1.9 mb/d Netherlands — 1.8 mb/d (Rotterdam — EU's "gateway") Italy — 1.5 mb/d Spain — 1.3 mb/d Singapore — 1.2 mb/d
OPEC+ Decisions and Market Impact (Updated January 2026)
November 30, 2025 (35th Ministerial Meeting)
Decision: Extend voluntary group cuts of 2.2 mb/d through Q1 2026. Effective period: January 1 – March 31, 2026.
March 3, 2026 (Expected)
In-person meeting in Riyadh. Will consider gradual unwinding of voluntary cuts starting Q2 2026, contingent on "sustained demand growth and declining OECD commercial inventories."
Why Specifically Until March 31, 2026?
Seasonal demand: Q1 is traditionally weaker for consumption; extending cuts helps prevent inventory buildup.
Market uncertainty: January–February brought EU recession risks and Suez Canal logistics disruptions.
Tengiz incident: The 0.45 mb/d reduction from Kazakhstan further tightens the balance, prompting OPEC+ to "play it safe" and maintain discipline.
Price Expectations
Confident bullish bias amid OPEC production cuts leading up to the next meeting.
Key level and first target: 73.30 USD
Scenario A: Cuts Unwound on March 3
Price returns to 59 USD Followed by a correction to 64 USD (China restocks at a discount) Further decline to 52 USD possible — I lean toward this scenario
Scenario B: Cuts Extended for Another Quarter
Sideways movement: 72–76 USD Potential spike to 80–81 USD Then retracement to 68.50 USD
Why I Consider Scenario B Unlikely
The weighted-average discount on Russian barrels vs. Brent is ≈12 USD/barrel; during congestion or rising freight rates, it temporarily widens to 14–15 USD.
Meaningful damage to the Russian economy only occurs when oil revenues fall below 70 USD.
Sanctions are designed to keep oil prices within a range that is painful for Russia. Therefore, prices will absolutely not be allowed above 82 USD.
In other words, to maintain sanctions effectiveness during the conflict, the logical approach is to cap prices at 74 USD.
İşlem aktif
SinnSeed 📊 EIA STEO | February 2026 — Full Breakdown🗓 On February 10, the EIA released its updated Short-Term Energy Outlook ( #STEO ). Modeling was finalized on February 5 — incorporating Winter Storm Fern, a cold January, and updated infrastructure expectations for the #Permian Basin. Below are the key changes versus the January report and what they mean for markets.
—
🛢 U.S. Crude Oil Production (crude oil + lease condensate)
▪️ 2025: 13.60M bpd (–0.1% vs January forecast) ▪️ 2026: 13.60M bpd (+0.1% — revised up) ▪️ 2027: 13.32M bpd (–2.1% vs 2026 — first detailed projection)
❓ Why was 2026 revised higher? The Permian Basin thesis — new pipelines coming online in H2 2026 unlock production growth. January cold snaps knocked out ~320K bpd, but the impact is temporary — recovery already underway in February.
🔼 Trend: growth in 2024–2025 (~2.8%) → plateau → decline begins in 2027. ⚖️ Globally: supply exceeds demand → inventories build → downward pressure on prices.
🔗 Recall the forecast: USDRUB — Current Thoughts — 01/25/2026 — What's Next here
So far, everything is going according to plan.
Updated oil scenario
—
🔥 Natural Gas (dry gas production)
▪️ 2025: ~110 Bcf/d (+1 Bcf/d vs January) ▪️ 2026: 120.8 Bcf/d marketed production (+2%, +2 Bcf/d vs forecast) ▪️ 2027: 122.3 Bcf/d — all-time record (+1% vs 2026)
Growth drivers: recovery after a 3% January decline, elevated prices in H1 2026 incentivize drilling, new Permian pipelines. Leading basins: Appalachia, Haynesville, and Permian (~69% of 2026–2027 production growth).
Henry Hub (spot): ▪️ 2026: 4.30–4.31 USD/MMBtu (+25% vs January's 3.46 — depleted storage post-winter) ▪️ 2027: ~4.40 USD/MMBtu (–5% vs January — more supply → market rebalances)
—
💧 Natural Gas Liquids (NGL)
▪️ 2025: 7.47M bpd (+0.3%) ▪️ 2026: ~7.51M bpd (mixed signals, overall trend — up) ▪️ 2027: ~7.71M bpd (+0.1–2.7%)
NGL production rises alongside gas — associated liquids from Permian and Haynesville basins.
—
⚡️ What This Means for Markets
Oil ( #Brent / #WTI ): Global surplus → Brent at 58 USD/bbl in 2026, likely 53 USD/bbl in 2027 (down from 69 USD/bbl in 2025). 📊 Inventories grow by 3.1M bpd in 2026. U.S. supply remains elevated — #OPEC+ pricing power erodes.
Gas: Short-term — high prices (Feb–Mar) → drilling incentive → production ramp → normalization by 2027.
💵 Who benefits: 🔹 Shale producers ( #DVN , #CTRA , etc.) 🔹 Midstream operators (pipeline companies) 🔹 LNG exporters — higher volumes
💵 Who loses: 🔹 Oil and gas importers, OPEC+ nations — price premium narrows
🖥 Official sources: 🔗 Charts here | 🔗 Full report here

İlgili yayınlar
Feragatname
Bilgiler ve yayınlar, TradingView tarafından sağlanan veya onaylanan finansal, yatırım, alım satım veya diğer türden tavsiye veya öneriler anlamına gelmez ve teşkil etmez. Kullanım Koşulları bölümünde daha fazlasını okuyun.
Feragatname
Bilgiler ve yayınlar, TradingView tarafından sağlanan veya onaylanan finansal, yatırım, alım satım veya diğer türden tavsiye veya öneriler anlamına gelmez ve teşkil etmez. Kullanım Koşulları bölümünde daha fazlasını okuyun.