
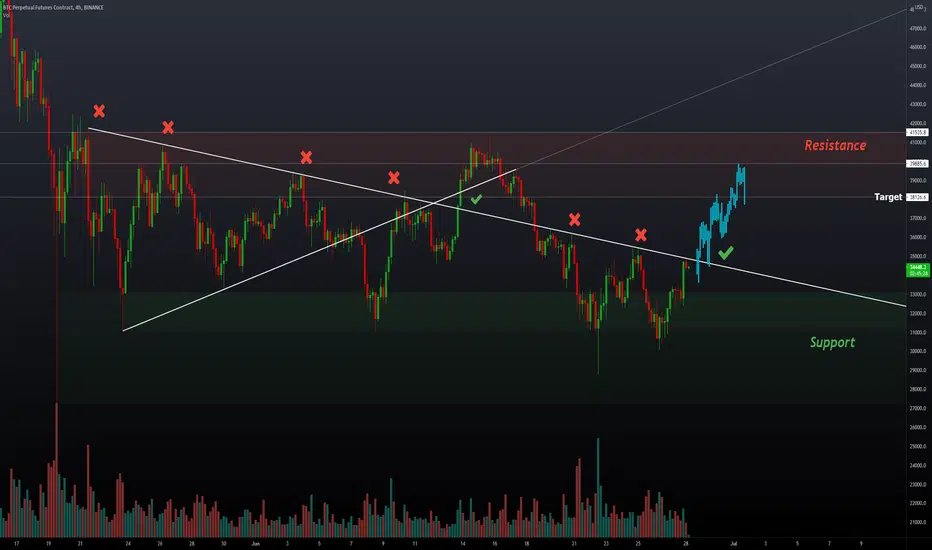
Just a quick chart, as you can see the downtrend line from the previous Symmetrical Triangle is pretty important if price can find support above this area marked with a green tick its likely BTC Heads up to the marked Resistance area.
Not
Not
Under the resistance again on this, might have to re draw the X haha
Feragatname
Bilgiler ve yayınlar, TradingView tarafından sağlanan veya onaylanan finansal, yatırım, alım satım veya diğer türden tavsiye veya öneriler anlamına gelmez ve teşkil etmez. Kullanım Koşulları bölümünde daha fazlasını okuyun.
Feragatname
Bilgiler ve yayınlar, TradingView tarafından sağlanan veya onaylanan finansal, yatırım, alım satım veya diğer türden tavsiye veya öneriler anlamına gelmez ve teşkil etmez. Kullanım Koşulları bölümünde daha fazlasını okuyun.