
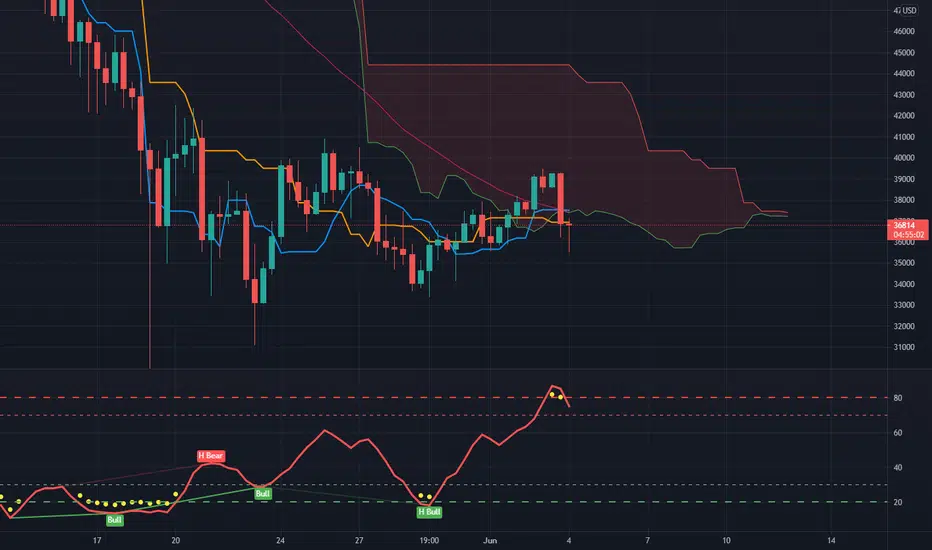
The 10 hour chart on Bitcoin looks super bearish in my opinion. Price is below the cloud. The 50 SMA is pointing down and bitcoin hasn't been able to get back above the 50 SMA on hardly any of the hourly time frames.
Not
Kijun and Cloud angling down on the 35min chart Not
Broke out of the triangle. Currently retesting resistance before we drop Not
50 SMA on the 5 hour chart 
Feragatname
Bilgiler ve yayınlar, TradingView tarafından sağlanan veya onaylanan finansal, yatırım, alım satım veya diğer türden tavsiye veya öneriler anlamına gelmez ve teşkil etmez. Kullanım Koşulları bölümünde daha fazlasını okuyun.
Feragatname
Bilgiler ve yayınlar, TradingView tarafından sağlanan veya onaylanan finansal, yatırım, alım satım veya diğer türden tavsiye veya öneriler anlamına gelmez ve teşkil etmez. Kullanım Koşulları bölümünde daha fazlasını okuyun.