
#BTCUSD #1hr #Bybit #Tommy
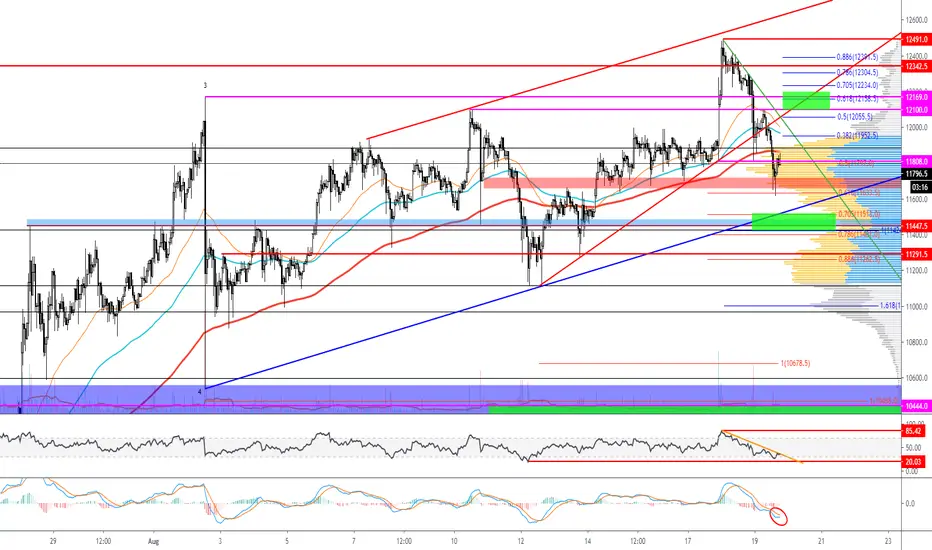
- Here is BTCUSD 1hr chart. BTC has broken above the major price lines and resistances yesterday, and then broke all of those down again. What a surprise.
- Pay attention to the red box I have drawn on the chart. It retested on this box which I have been considering as a significant price area where price gets resisted when it’s under it, and gets supported when it’s over it.
- If we see more bearish moves, I am expecting support at 11420~11520. This is the area where blue trendline passes and the 1:1 of Fib extension of the corrective waves overlap.
- Moreover, please keep an eye on the green downward trendline. Later when BTC reaches this line, we might expect some resistance from in a shorter term.
- The resistance that I am currently considering is 12100~12200. This is where red trendline retest area is located and thus is only valid until 24 hours from now. Later I will update this area.
- Lastly, keep an eye on the RSI orange trendline. When RSI succeeds to break this over and the candle closes, we can expect some more bullish momentum. Also be aware that MACD’s moving averages are converging towards each other. When it shows golden-cross, it can be interpreted as a bullish signal.
- Here is BTCUSD 1hr chart. BTC has broken above the major price lines and resistances yesterday, and then broke all of those down again. What a surprise.
- Pay attention to the red box I have drawn on the chart. It retested on this box which I have been considering as a significant price area where price gets resisted when it’s under it, and gets supported when it’s over it.
- If we see more bearish moves, I am expecting support at 11420~11520. This is the area where blue trendline passes and the 1:1 of Fib extension of the corrective waves overlap.
- Moreover, please keep an eye on the green downward trendline. Later when BTC reaches this line, we might expect some resistance from in a shorter term.
- The resistance that I am currently considering is 12100~12200. This is where red trendline retest area is located and thus is only valid until 24 hours from now. Later I will update this area.
- Lastly, keep an eye on the RSI orange trendline. When RSI succeeds to break this over and the candle closes, we can expect some more bullish momentum. Also be aware that MACD’s moving averages are converging towards each other. When it shows golden-cross, it can be interpreted as a bullish signal.

토미 유튜브: youtube.com/@TommyTradingTV
제 모든 인사이트, 분석, 관점은 t.me/tommy_trading 에 가장 먼저 올라갑니다!
제 모든 인사이트, 분석, 관점은 t.me/tommy_trading 에 가장 먼저 올라갑니다!
İlgili yayınlar
Feragatname
Bilgiler ve yayınlar, TradingView tarafından sağlanan veya onaylanan finansal, yatırım, alım satım veya diğer türden tavsiye veya öneriler anlamına gelmez ve teşkil etmez. Kullanım Koşulları bölümünde daha fazlasını okuyun.
토미 유튜브: youtube.com/@TommyTradingTV
제 모든 인사이트, 분석, 관점은 t.me/tommy_trading 에 가장 먼저 올라갑니다!
제 모든 인사이트, 분석, 관점은 t.me/tommy_trading 에 가장 먼저 올라갑니다!
İlgili yayınlar
Feragatname
Bilgiler ve yayınlar, TradingView tarafından sağlanan veya onaylanan finansal, yatırım, alım satım veya diğer türden tavsiye veya öneriler anlamına gelmez ve teşkil etmez. Kullanım Koşulları bölümünde daha fazlasını okuyun.