
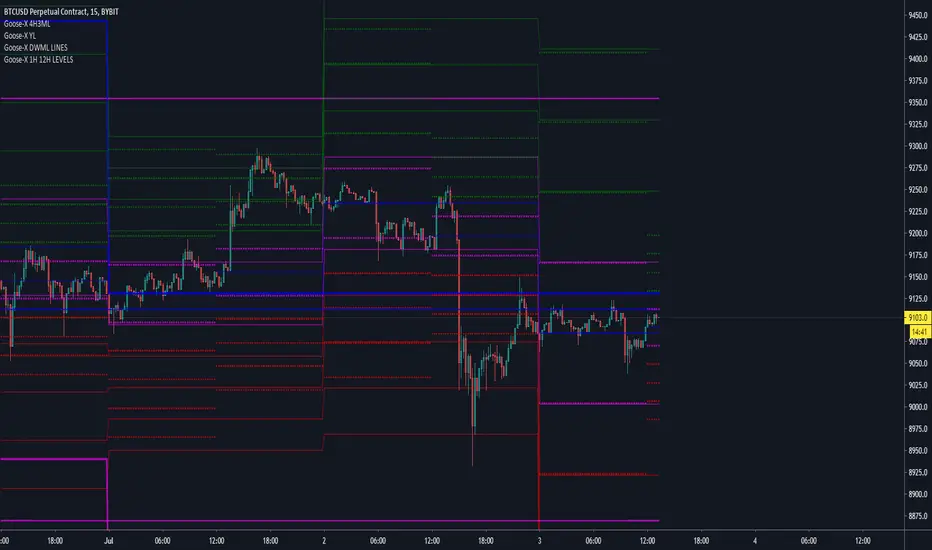
Chart containing all GX levels ( support/resistance ) of various periods: 1hr, 4hr, 12hr, 1day, 1week, 1month, 3months, 1year.
These are the most important and pre-fixed support/resist zones already written at every 00:00 UTC of the used period.
For example yearly levels are written there since 1° Jan 2020 00:00 UTC
These are the most important and pre-fixed support/resist zones already written at every 00:00 UTC of the used period.
For example yearly levels are written there since 1° Jan 2020 00:00 UTC

Feragatname
Bilgiler ve yayınlar, TradingView tarafından sağlanan veya onaylanan finansal, yatırım, alım satım veya diğer türden tavsiye veya öneriler anlamına gelmez ve teşkil etmez. Kullanım Koşulları bölümünde daha fazlasını okuyun.
Feragatname
Bilgiler ve yayınlar, TradingView tarafından sağlanan veya onaylanan finansal, yatırım, alım satım veya diğer türden tavsiye veya öneriler anlamına gelmez ve teşkil etmez. Kullanım Koşulları bölümünde daha fazlasını okuyun.