
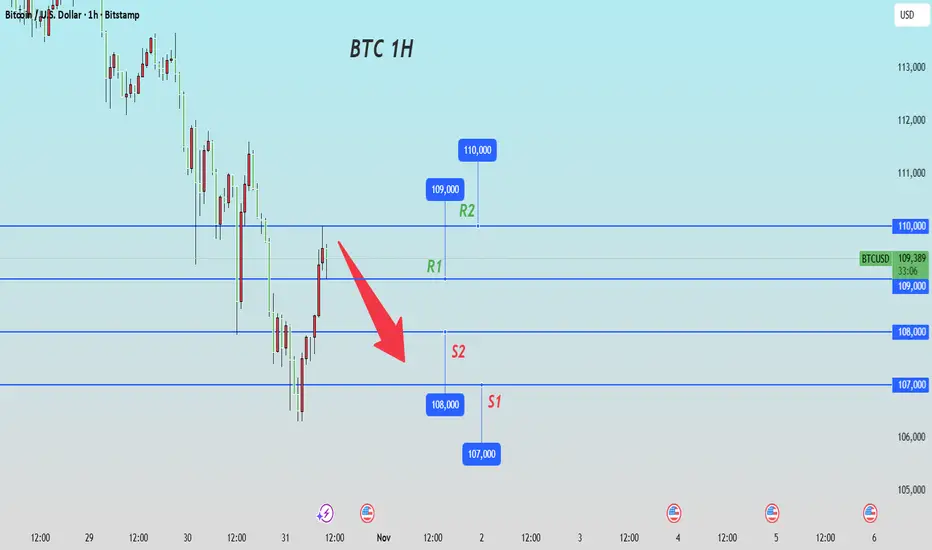
Technical aspect: "Support broken + Trend continuation", the bearish dominant pattern has been established
The price has successfully broken through the key support range: $109,100 is located between the psychological threshold of $110,000 and the 200-day moving average ($107,846). The 1-hour chart shows that after the price continuously attempted to reach $110,000 for 3 times without success, it formed a "head and shoulders top" pattern and broke through, with the neckline at $109,500 being lost. After that, the decline measured pointed to $107,000. More importantly, the 50-day moving average at the daily level has crossed below the 100-day moving average, forming a "death cross". This is the first medium-term bearish signal since 2024 May. Historical data shows that when such a technical combination occurs, the average decline within 5 trading days is 5.3%. Meanwhile, although the RSI indicator has entered the oversold zone, there is no divergence signal, indicating that the downward momentum has not yet exhausted.
Today's Bitcoin Trading Strategy
sell:109000-110000
tp:108000-107000
sl:111000
İşlem aktif
Wish you a wonderful day!
Feragatname
Bilgiler ve yayınlar, TradingView tarafından sağlanan veya onaylanan finansal, yatırım, alım satım veya diğer türden tavsiye veya öneriler anlamına gelmez ve teşkil etmez. Kullanım Koşulları bölümünde daha fazlasını okuyun.
Feragatname
Bilgiler ve yayınlar, TradingView tarafından sağlanan veya onaylanan finansal, yatırım, alım satım veya diğer türden tavsiye veya öneriler anlamına gelmez ve teşkil etmez. Kullanım Koşulları bölümünde daha fazlasını okuyun.