
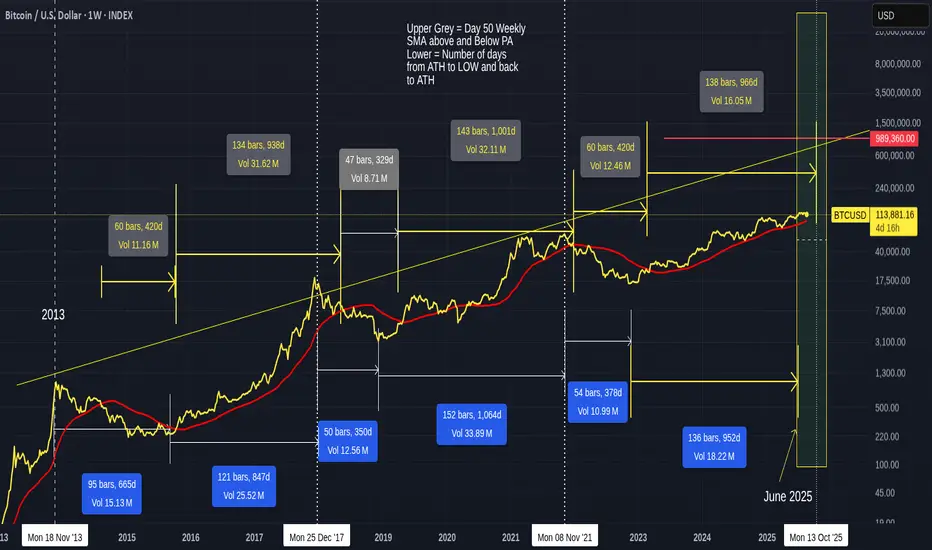
Following on from Yesterdays post about how the 50 and 100 SMA are showing us possible Top and yet, at the same time, showing us we have a Few months left to go maybe, This Chart uses Just the 50 Weekly SMA ( RED )and how many days above and Below PA it has been since 2013.
We have had only 2 complete sets and so, we have to use this cautiously BUT it does point us in certain directions.
So..using the Number sets ABOVE PA.....
From 2013, After that ATH, PA went below PA for 420 days, went back above for 938 days.
From just after the 2017 ATH, PA went below PA for 329 days, went back above for 1001 days ( ignoring the March 2020 Covid Crash )
From just after the 2021 ATH, PA went below PA for 420 days ( we it did after 2013 ATH).
And Currently, we have PA remaining above the 50 SMA and we cannot predict accurately when PA will drop back below But, using the previous cycles, we could expect that to happen iaround October.
This usualy happens AFTER the ATH, with in weeks.
Using this alone, we could say we have have now Past the ATH zone for this cycle.
The Number sets BELOW PA are simply ATH to LOW and back to ATH
Again, this shows us we have past tha ATH point.
This cycle has shown us a number of differences though. See how PA has remained so much closer to the 50 SMa all the way and has already bounced off it 3 times.
PA is currently above and has a nice Gap to the 50 as we can see on the chart below.
Should PA dive down today, it would find the 50 SMA around 95K.
Could PA do this YES
Is it likely to do this, NO, noy currently but we need tii understand that we have No conclusive proof to allow us to relax.
Both sets of SMA data that I have posted over the last 2 days show us we ARE in an expected TOP zone, anytime from now to January
And we certainly do not know what will happen after.
However, the way BTC is being Held on to and the Adoption world wide, could point towards a lack of a Bear market maybe.
For me, as pointed out in other posts, I do believe that we are moving into a New era of Bitcoin Patterns and this is mostly lead by the simple fact that BTC PA HAS to break UP....
The pattern this cycle is Muted, a "controlled" Rise, no sharp rises and Fallls....( Not controlled by a person but more by wide spread Holding...)
So, to conclude,,,New Days ahead for Bitcoin but we need to remain cautious for now...
The Next Few months will tell us everything.

Nothing to be taken as Financial advice.
I will always say
"Only invest what you can afford to loose. When you are ready, take out your original investment. This way, it is only your profit that is at risk"
THAT is Financial advice
I will always say
"Only invest what you can afford to loose. When you are ready, take out your original investment. This way, it is only your profit that is at risk"
THAT is Financial advice
Feragatname
Bilgiler ve yayınlar, TradingView tarafından sağlanan veya onaylanan finansal, yatırım, alım satım veya diğer türden tavsiye veya öneriler anlamına gelmez ve teşkil etmez. Kullanım Koşulları bölümünde daha fazlasını okuyun.
Nothing to be taken as Financial advice.
I will always say
"Only invest what you can afford to loose. When you are ready, take out your original investment. This way, it is only your profit that is at risk"
THAT is Financial advice
I will always say
"Only invest what you can afford to loose. When you are ready, take out your original investment. This way, it is only your profit that is at risk"
THAT is Financial advice
Feragatname
Bilgiler ve yayınlar, TradingView tarafından sağlanan veya onaylanan finansal, yatırım, alım satım veya diğer türden tavsiye veya öneriler anlamına gelmez ve teşkil etmez. Kullanım Koşulları bölümünde daha fazlasını okuyun.