
Market Structure
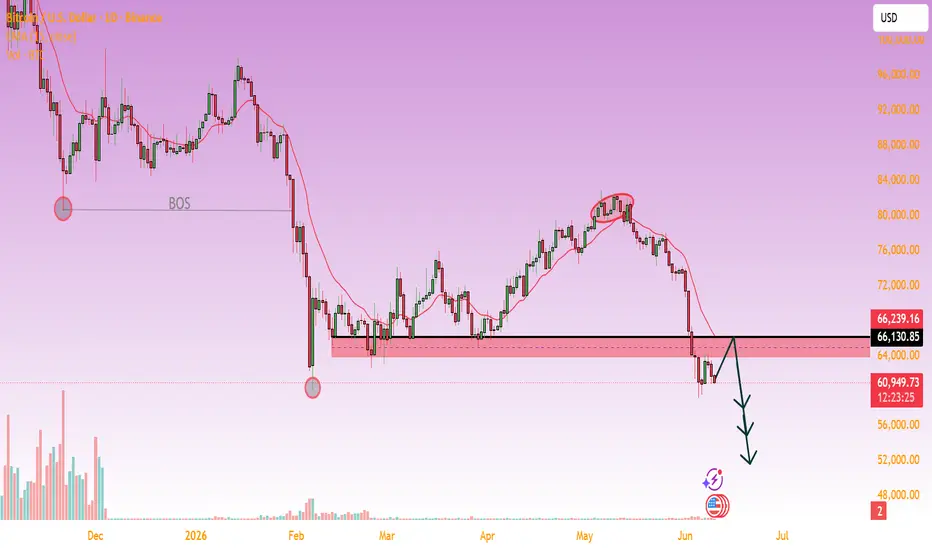
This BTCUSD 1D chart shows a clear bearish market structure shift:
The previous support around $80,000 was broken earlier (marked as BOS – Break of Structure).
After the breakdown, price formed a lower high and failed to reclaim previous resistance.
The recent selloff pushed BTC below the important $64,000–$66,000 support zone (highlighted in pink).
Key Technical Observations
✅ Support Turned Resistance
The black horizontal level around $66,130 acted as support multiple times.
Price has now broken below it, making it a potential resistance area.
✅ Bearish Retest Setup
The drawn projection suggests a pullback toward the broken zone.
If sellers defend the $64K–$66K area, the retest could trigger another leg down.
✅ Moving Average Pressure
Price is trading below the red moving average.
The moving average is sloping downward, confirming bearish momentum.
Bearish Scenario (Higher Probability Based on Current Structure)
Price retests $64K–$66K.
Rejection from resistance.
Continuation toward lower liquidity zones.
Potential downside targets:
$58,000
$55,000
$52,000
$50,000 psychological level
Invalidation
The bearish outlook weakens if:
BTC closes back above $66,130.
Buyers reclaim the resistance zone and hold it as support.
A higher high forms above the recent swing high near $81,000.
Trading Bias
Current Bias: Bearish 📉
As long as BTC remains below the $64K–$66K supply/resistance zone, sellers appear to control the market and further downside remains likely.
This BTCUSD 1D chart shows a clear bearish market structure shift:
The previous support around $80,000 was broken earlier (marked as BOS – Break of Structure).
After the breakdown, price formed a lower high and failed to reclaim previous resistance.
The recent selloff pushed BTC below the important $64,000–$66,000 support zone (highlighted in pink).
Key Technical Observations
✅ Support Turned Resistance
The black horizontal level around $66,130 acted as support multiple times.
Price has now broken below it, making it a potential resistance area.
✅ Bearish Retest Setup
The drawn projection suggests a pullback toward the broken zone.
If sellers defend the $64K–$66K area, the retest could trigger another leg down.
✅ Moving Average Pressure
Price is trading below the red moving average.
The moving average is sloping downward, confirming bearish momentum.
Bearish Scenario (Higher Probability Based on Current Structure)
Price retests $64K–$66K.
Rejection from resistance.
Continuation toward lower liquidity zones.
Potential downside targets:
$58,000
$55,000
$52,000
$50,000 psychological level
Invalidation
The bearish outlook weakens if:
BTC closes back above $66,130.
Buyers reclaim the resistance zone and hold it as support.
A higher high forms above the recent swing high near $81,000.
Trading Bias
Current Bias: Bearish 📉
As long as BTC remains below the $64K–$66K supply/resistance zone, sellers appear to control the market and further downside remains likely.

Join My telegram channel Free:
t.me/+r-thYiraqh4xNjI0
t.me/+r-thYiraqh4xNjI0
Feragatname
Bilgiler ve yayınlar, TradingView tarafından sağlanan veya onaylanan finansal, yatırım, alım satım veya diğer türden tavsiye veya öneriler anlamına gelmez ve teşkil etmez. Kullanım Koşulları bölümünde daha fazlasını okuyun.
Join My telegram channel Free:
t.me/+r-thYiraqh4xNjI0
t.me/+r-thYiraqh4xNjI0
Feragatname
Bilgiler ve yayınlar, TradingView tarafından sağlanan veya onaylanan finansal, yatırım, alım satım veya diğer türden tavsiye veya öneriler anlamına gelmez ve teşkil etmez. Kullanım Koşulları bölümünde daha fazlasını okuyun.