
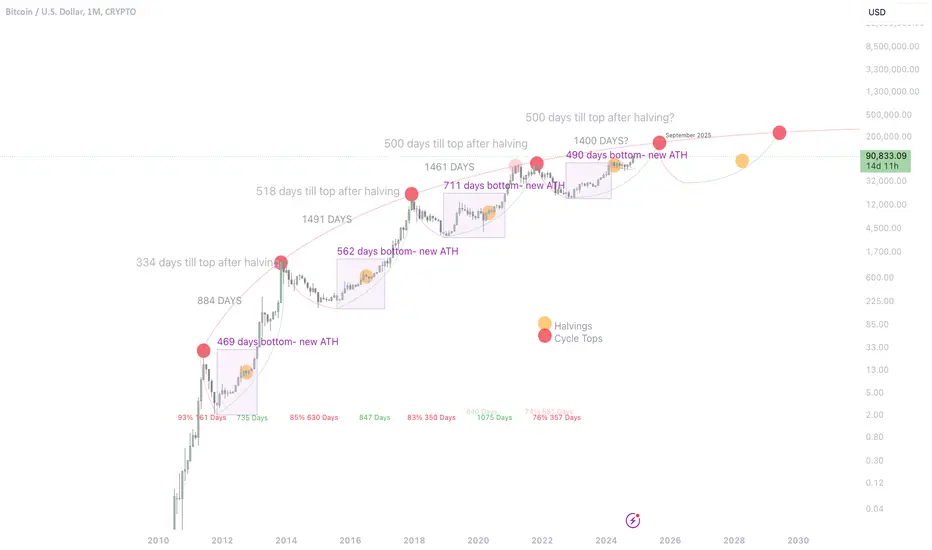
This chart highlights the remarkable consistency in Bitcoin's historical cycles, showcasing how price movements align across different cycles in terms of duration (days) and percentage changes. By visualizing these repeating patterns, you can gain valuable insights into Bitcoin's cyclical behavior and potential future trends.

Feragatname
Bilgiler ve yayınlar, TradingView tarafından sağlanan veya onaylanan finansal, yatırım, alım satım veya diğer türden tavsiye veya öneriler anlamına gelmez ve teşkil etmez. Kullanım Koşulları bölümünde daha fazlasını okuyun.
Feragatname
Bilgiler ve yayınlar, TradingView tarafından sağlanan veya onaylanan finansal, yatırım, alım satım veya diğer türden tavsiye veya öneriler anlamına gelmez ve teşkil etmez. Kullanım Koşulları bölümünde daha fazlasını okuyun.