
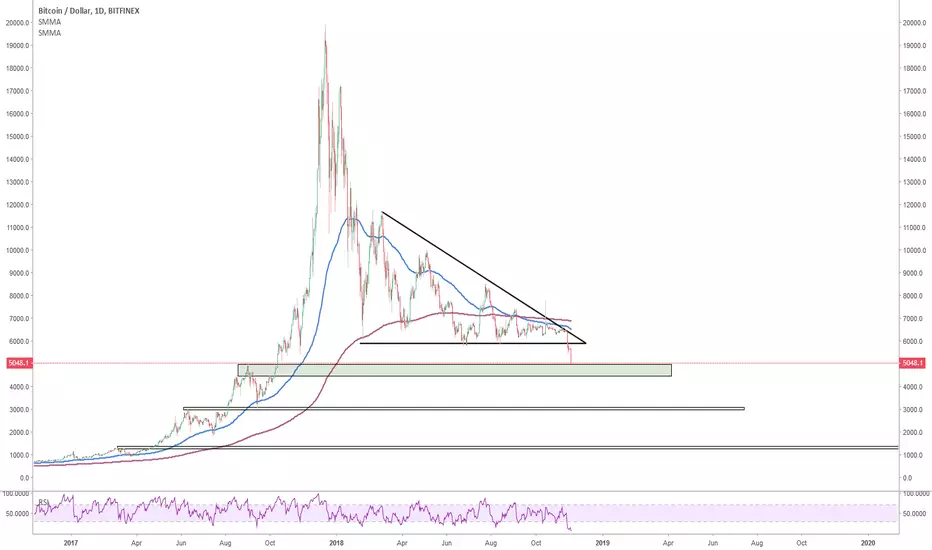
Possible supports
Let's see
Let's see
Not
This is the first supportive area where we want to see a bounce or a false breakout to see if this thing still have some buyersVolume will be important to watch
Not
Truely impressive
Not
Bitcoin was testing the end of 2017-2018 hodlersNow it is testing the early-mid 2017 hodlers
Now this is a psychological game of ranges and areas, and not a game of value
Not
Doesn't look that spectacularNot
Forming a v reversal on the 4400 support areaAgain, let's see how it goes after that
Not
I swear i did not touch it lol
Not
Daily candle (screenshot above is a 4h chart) shows a possible false breakout, even the day isn't over
Which means, if it is a false breakout, that Bitcoin could search for some stability in this 4400-5500 area
We will see, not a time to gamble anyway, this support could break and sent Btc right to the 2970$ zone, target of the descending triangle

Feragatname
Bilgiler ve yayınlar, TradingView tarafından sağlanan veya onaylanan finansal, yatırım, alım satım veya diğer türden tavsiye veya öneriler anlamına gelmez ve teşkil etmez. Kullanım Koşulları bölümünde daha fazlasını okuyun.
Feragatname
Bilgiler ve yayınlar, TradingView tarafından sağlanan veya onaylanan finansal, yatırım, alım satım veya diğer türden tavsiye veya öneriler anlamına gelmez ve teşkil etmez. Kullanım Koşulları bölümünde daha fazlasını okuyun.