
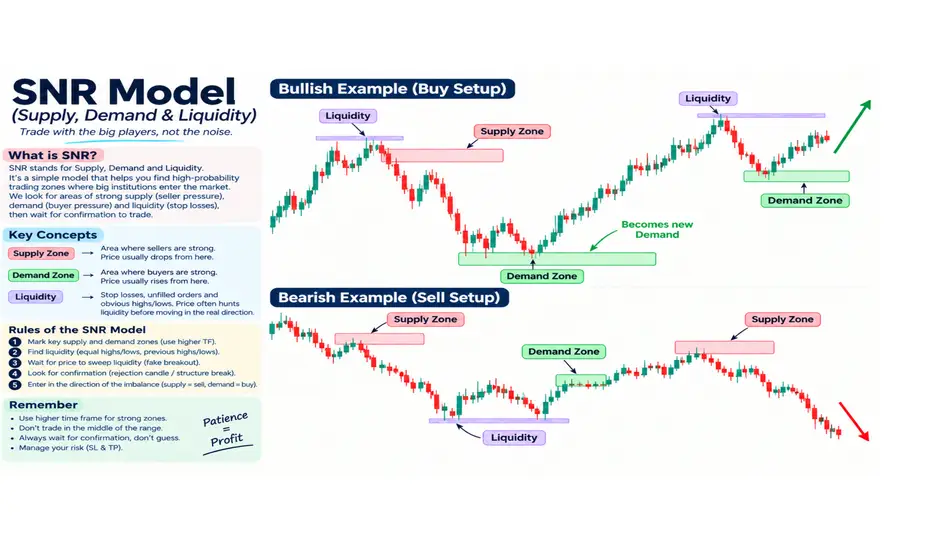
SNR (Supply, Demand & Liquidity) is a simple price-action framework used to identify important areas where buying and selling pressure may appear.
In the examples above, the model focuses on three key elements:
🔴 Supply Zone — An area where strong selling pressure may appear. Price can react or move
lower after returning to this zone.
🟢 Demand Zone — An area where buying pressure may appear. Price can react or move higher
after returning to this zone.
🟣 Liquidity — Areas around obvious highs/lows where stop orders may be concentrated. Price
may sweep these levels before making a stronger move.
📈 Bullish Example
Price first interacts with liquidity and then moves into/around a demand area. After confirmation and a change in market structure, traders can look for a potential buy setup from demand, with the next liquidity or resistance area as a potential target.
📉 Bearish Example
Price reacts around a supply zone while liquidity is taken near previous highs/lows. After bearish confirmation or a structure break, traders can look for a potential sell setup, targeting lower demand/liquidity areas.
🔑 SNR Model Process
1. Identify Supply & Demand → 2. Mark Liquidity → 3. Wait for Liquidity Sweep → 4. Look for
Confirmation → 5. Enter After Confirmation → 6.
Manage RiskManagement Tips
1. Risk only 1–2% per trade
Never put a large portion of your account at risk on one trade. Keep your position size based on your stop-loss distance.
2. Always use a Stop-Loss (SL)
Place your SL at a logical invalidation level, not randomly. Define your SL and Take-Profit (TP) before entering the trade.
In the examples above, the model focuses on three key elements:
🔴 Supply Zone — An area where strong selling pressure may appear. Price can react or move
lower after returning to this zone.
🟢 Demand Zone — An area where buying pressure may appear. Price can react or move higher
after returning to this zone.
🟣 Liquidity — Areas around obvious highs/lows where stop orders may be concentrated. Price
may sweep these levels before making a stronger move.
📈 Bullish Example
Price first interacts with liquidity and then moves into/around a demand area. After confirmation and a change in market structure, traders can look for a potential buy setup from demand, with the next liquidity or resistance area as a potential target.
📉 Bearish Example
Price reacts around a supply zone while liquidity is taken near previous highs/lows. After bearish confirmation or a structure break, traders can look for a potential sell setup, targeting lower demand/liquidity areas.
🔑 SNR Model Process
1. Identify Supply & Demand → 2. Mark Liquidity → 3. Wait for Liquidity Sweep → 4. Look for
Confirmation → 5. Enter After Confirmation → 6.
Manage RiskManagement Tips
1. Risk only 1–2% per trade
Never put a large portion of your account at risk on one trade. Keep your position size based on your stop-loss distance.
2. Always use a Stop-Loss (SL)
Place your SL at a logical invalidation level, not randomly. Define your SL and Take-Profit (TP) before entering the trade.

Join Telegram channel for daily free signals
t.me/+pNdCz04k71tjZTQ0
Best recommended broker👇
one.exnessonelink.com/a/8zhsfu3hpf
t.me/+pNdCz04k71tjZTQ0
Best recommended broker👇
one.exnessonelink.com/a/8zhsfu3hpf
Feragatname
Bilgiler ve yayınlar, TradingView tarafından sağlanan veya onaylanan finansal, yatırım, alım satım veya diğer türden tavsiye veya öneriler anlamına gelmez ve teşkil etmez. Kullanım Koşulları bölümünde daha fazlasını okuyun.
Join Telegram channel for daily free signals
t.me/+pNdCz04k71tjZTQ0
Best recommended broker👇
one.exnessonelink.com/a/8zhsfu3hpf
t.me/+pNdCz04k71tjZTQ0
Best recommended broker👇
one.exnessonelink.com/a/8zhsfu3hpf
Feragatname
Bilgiler ve yayınlar, TradingView tarafından sağlanan veya onaylanan finansal, yatırım, alım satım veya diğer türden tavsiye veya öneriler anlamına gelmez ve teşkil etmez. Kullanım Koşulları bölümünde daha fazlasını okuyun.