
🔎 Market Structure
Medium-term trend: up
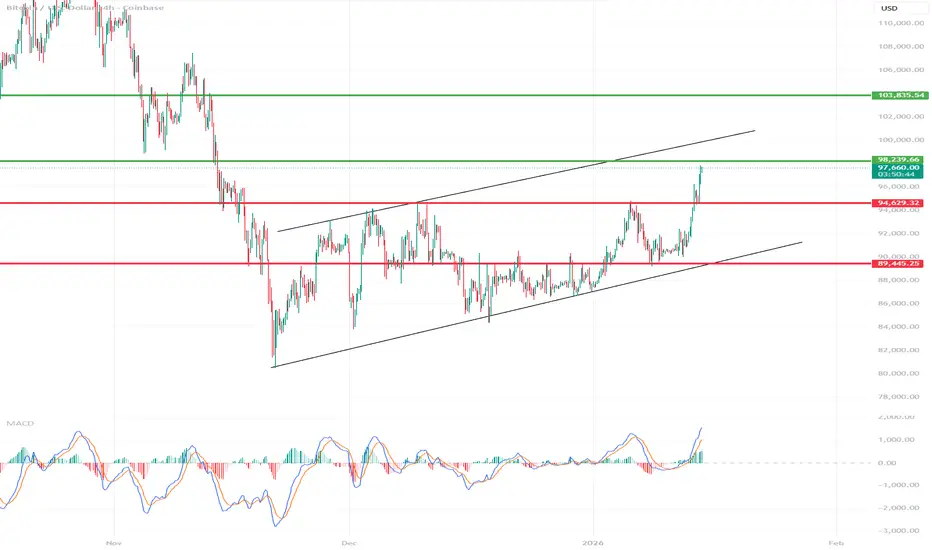
The price is moving within an ascending channel (the lower and upper limits are nicely respected).
Last move = upward impulse from a consolidation breakout.
📈 Current Situation
The price has broken out above key resistance at ~94,600 USD (red line)
We are currently in the 97,500–98,200 USD zone (local resistance).
This is the first test of this zone from below → a natural place for reaction.
🟩 Key Levels
Resistance
98,200–98,300 USD – local resistance (green line)
103,800 USD – main channel target / ATH region
Supports
94,600 USD – most important support (flip from resistance)
89,400 USD – middle of the structure + previous accumulation
Lower channel boundary ~87–88k USD – last defense
📊 MACD
Strong bullish crossover
The histogram is rising → upward momentum is accelerating
No downward divergence (on (for now)
➡️ This supports continued growth, not a reversal.
🧠 Scenarios
🟢 Baseline scenario (most likely)
Short consolidation/pullback
Retest of USD 94,600–95,000
Continuation up → 98k → 100k → 103–104k
🟡 Alternative scenario
Rejection of USD 98k
Drop to USD 89,400
Still uptrend as long as the channel holds
🔴 Bullish negation
4-hour close below 89,400
Then the structure breaks down → drop to 86–84k
Medium-term trend: up
The price is moving within an ascending channel (the lower and upper limits are nicely respected).
Last move = upward impulse from a consolidation breakout.
📈 Current Situation
The price has broken out above key resistance at ~94,600 USD (red line)
We are currently in the 97,500–98,200 USD zone (local resistance).
This is the first test of this zone from below → a natural place for reaction.
🟩 Key Levels
Resistance
98,200–98,300 USD – local resistance (green line)
103,800 USD – main channel target / ATH region
Supports
94,600 USD – most important support (flip from resistance)
89,400 USD – middle of the structure + previous accumulation
Lower channel boundary ~87–88k USD – last defense
📊 MACD
Strong bullish crossover
The histogram is rising → upward momentum is accelerating
No downward divergence (on (for now)
➡️ This supports continued growth, not a reversal.
🧠 Scenarios
🟢 Baseline scenario (most likely)
Short consolidation/pullback
Retest of USD 94,600–95,000
Continuation up → 98k → 100k → 103–104k
🟡 Alternative scenario
Rejection of USD 98k
Drop to USD 89,400
Still uptrend as long as the channel holds
🔴 Bullish negation
4-hour close below 89,400
Then the structure breaks down → drop to 86–84k

Feragatname
Bilgiler ve yayınlar, TradingView tarafından sağlanan veya onaylanan finansal, yatırım, alım satım veya diğer türden tavsiye veya öneriler anlamına gelmez ve teşkil etmez. Kullanım Koşulları bölümünde daha fazlasını okuyun.
Feragatname
Bilgiler ve yayınlar, TradingView tarafından sağlanan veya onaylanan finansal, yatırım, alım satım veya diğer türden tavsiye veya öneriler anlamına gelmez ve teşkil etmez. Kullanım Koşulları bölümünde daha fazlasını okuyun.