
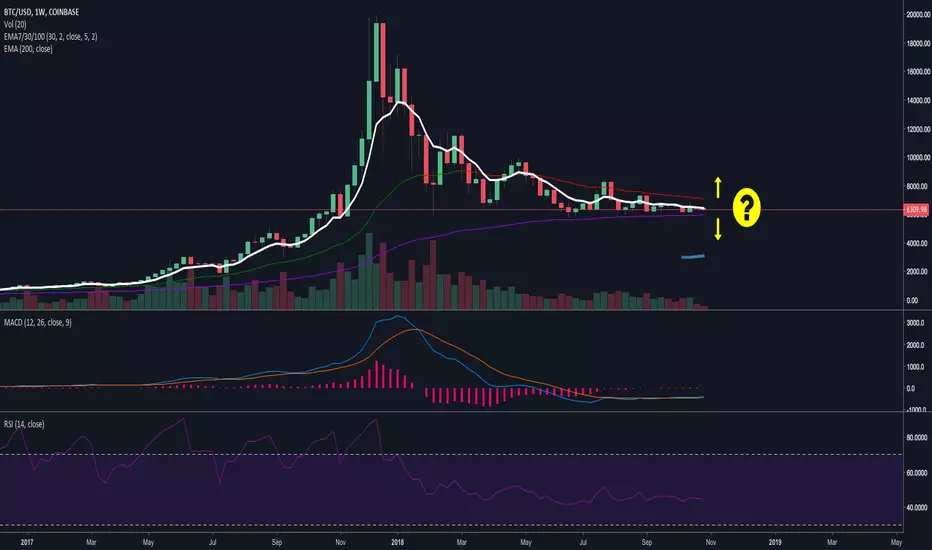
Hello traders and watchers, I would like to start Bitcoin Chronicle, this is a weekly conversation about situation at the market, with the assumptions on what direction the price will move in the near term. This mean I will update this thread daily till sunday, then I will create the new BTC Chronicles every next week, so it will be easy to check the history and to planning & analysis in general.
I will use next types of TF: 30M, 4H, 1D and 3D.
Indicators: EMA lines, MACD, RSI.
Exchange: Coinbase.
Let's start and GL you all!
I will use next types of TF: 30M, 4H, 1D and 3D.
Indicators: EMA lines, MACD, RSI.
Exchange: Coinbase.
Let's start and GL you all!
Not
The situation with daily trend is clear to understand, the price is trading below EMA lines, so at the moment I don't see the right point where I can build a long-term position. 7 and 30 EMA lines created the strong resistance channel between $6350 and $6400 therefore better to wait when the price will rise higher than levels mention above and then to decide about long or short deal.
30M:
Not
See you tomorrow! GL!Not
4H TF:And we are at the flat market again, well... I think there is no needed to check MACD or RSI indicators because they don't work here. When you've planned something well, there's no need to rush, in our case I want to wait when the price gives us the buy signal. It's high risk to buy here while we have only one support line.
Not
1Day TF:Ok, here is resistance and resistance and resistance...
7EMA - Resistance line
30EMA - Resistance line
100EMA - Resistance line
200EMA - Resistance line
Okay, so, all of this points to the bearish market, if you are a bolder person, you can short BTCUSD to make profit, but don't forget about stop loss.
Not
See you tomorrow! GL!Not
30M ChartIf the market was bullish, I would said "buy it now", the price must rise above the resistance level @6400, and show the new highs. But we're on bearish market and here we should be very careful and smart.
The only obstacle here is the resistance level which was formed in middle October. If there will be enough power Bitcoin can rise higher, we need volume from MM.
Not
4H ChartHere we can see two identical resistance elements: 200EMA line and the channel which formed in October, its cross at $6400, so I can assume that price would trading around it or will back to $6200 again. $6400 could be the u-turn point of the downtrend.
Not
See you tomorrow! GL!
Feragatname
Bilgiler ve yayınlar, TradingView tarafından sağlanan veya onaylanan finansal, yatırım, alım satım veya diğer türden tavsiye veya öneriler anlamına gelmez ve teşkil etmez. Kullanım Koşulları bölümünde daha fazlasını okuyun.
Feragatname
Bilgiler ve yayınlar, TradingView tarafından sağlanan veya onaylanan finansal, yatırım, alım satım veya diğer türden tavsiye veya öneriler anlamına gelmez ve teşkil etmez. Kullanım Koşulları bölümünde daha fazlasını okuyun.