
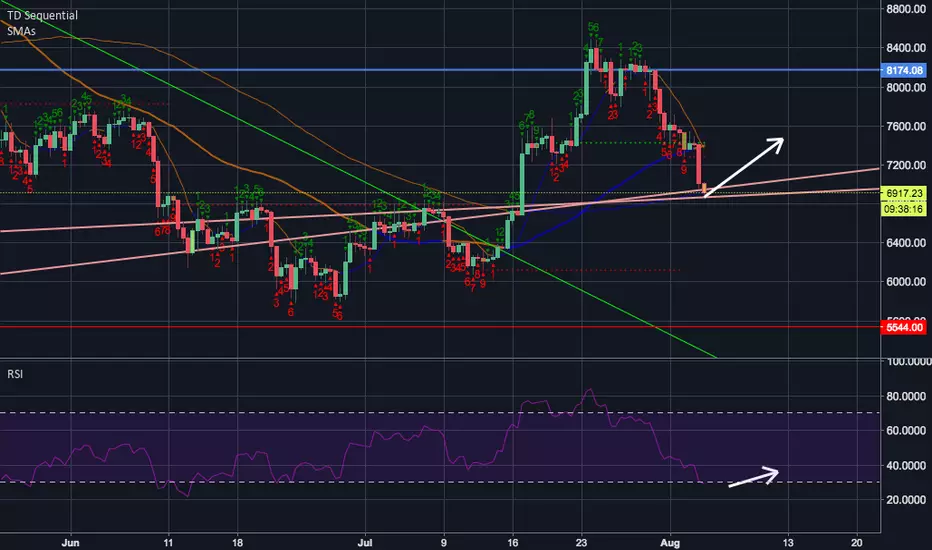
According to the 12/Hour chart: The RSI is around 30, which is pretty low. And Bitcoin is currently on the 13th candle; which could be could news for Bulls since Bitcoin is also at 2 key support points (the red lines).
If Bitcoin can't hold the support around $6870, the next support line will be around $5540.
The 6/Hour Chart:

The Daily Chart:

The Weekly Chart:

If Bitcoin can't hold the support around $6870, the next support line will be around $5540.
The 6/Hour Chart:
The Daily Chart:
The Weekly Chart:
Not
The 6/Hour Chart:As you can see below, Bitcoin is currently on a green '1' candle -- sitting directly on the 2 support lines I previously pointed out.
Now let's look at Bitcoin's 4/Hour Chart:
Bitcoin is currently on a green engulfing '2' candle. The '2' candle opened above the previous '1' candle around $7013.00.
At the time of this writing the price is $7028.
Bitcoin must maintain it's price along the pinkish-red support lines, as shown in the charts. If Bitcoin fails to maintain it's current support at this level -- The next support level is around $5500.
Not
Bitcoin couldn't sustain support. It fell below my two support points. The first support point (red candle 2) at $6975, and the second support point (red candle 3) at $6880. I'm officialy bearish at the moment.THE HOURLY CHART:
THE 6-HOUR CHART:
The daily chart is giving us a red '8' candle- almost completing a typical trend of 9 candles, meanwhile, the 12-hour chart is giving us a red '1' candle at the same time- POSSIBLY signaling a new downtrend.
**But keep in mind when using the TD-Sequential counting system, bitcoin doesn't always complete a 9 candle cycle/trend.
THE 12-HOUR Chart:
THE DAILY CHART:

Feragatname
Bilgiler ve yayınlar, TradingView tarafından sağlanan veya onaylanan finansal, yatırım, alım satım veya diğer türden tavsiye veya öneriler anlamına gelmez ve teşkil etmez. Kullanım Koşulları bölümünde daha fazlasını okuyun.
Feragatname
Bilgiler ve yayınlar, TradingView tarafından sağlanan veya onaylanan finansal, yatırım, alım satım veya diğer türden tavsiye veya öneriler anlamına gelmez ve teşkil etmez. Kullanım Koşulları bölümünde daha fazlasını okuyun.