
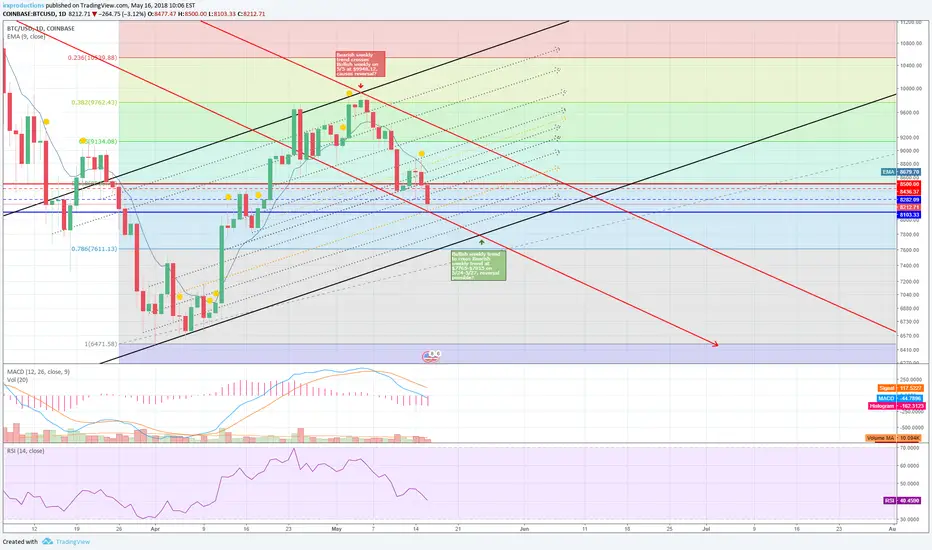
Looking at Bitcoin in the long-term using weekly trend lines, the recent Bearish reversal happened on 5/5 at a high of $9948.12 when a Bearish weekly trend (upper solid red) crossed with a Bullish weekly trend (upper black red).
Taking the theory to the next step, a lower Bearish weekly trend line (lower solid red) may cross with a lower Bullish weekly trend (lower solid black) between 5/24-5/27 at a rough price estimate of $7,765-$7,815.
Could this cause another reversal?
I'm still incredibly green at crypto Technical Analysis, so I'm hoping for to hear suggestions, ideas, and errors I may be making. Thanks, everyone!
Taking the theory to the next step, a lower Bearish weekly trend line (lower solid red) may cross with a lower Bullish weekly trend (lower solid black) between 5/24-5/27 at a rough price estimate of $7,765-$7,815.
Could this cause another reversal?
I'm still incredibly green at crypto Technical Analysis, so I'm hoping for to hear suggestions, ideas, and errors I may be making. Thanks, everyone!

Feragatname
Bilgiler ve yayınlar, TradingView tarafından sağlanan veya onaylanan finansal, yatırım, alım satım veya diğer türden tavsiye veya öneriler anlamına gelmez ve teşkil etmez. Kullanım Koşulları bölümünde daha fazlasını okuyun.
Feragatname
Bilgiler ve yayınlar, TradingView tarafından sağlanan veya onaylanan finansal, yatırım, alım satım veya diğer türden tavsiye veya öneriler anlamına gelmez ve teşkil etmez. Kullanım Koşulları bölümünde daha fazlasını okuyun.