
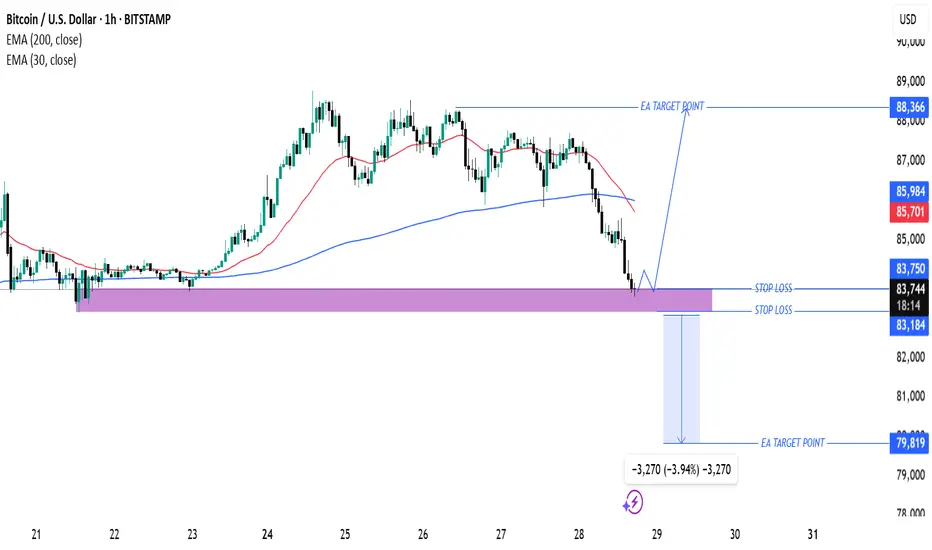
This chart is a Bitcoin (BTC/USD) price analysis on a 1-hour timeframe from TradingView. Here are the key insights:
Technical Indicators:
Exponential Moving Averages (EMAs):
200 EMA (blue): 85,984 (indicates long-term trend support/resistance).
30 EMA (red): 85,705 (short-term trend direction).
Support & Resistance Zones:
Purple Zone (Support Area): This area has been tested multiple times and is expected to provide a strong buying zone.
Resistance/Target Levels:
Upper EA Target Point: 88,366 (potential bullish target).
Lower EA Target Point: 79,819 (potential bearish target).
Trade Setup:
Entry Point: Around 83,810 (current price near support).
Stop Loss Levels:
Conservative: Around 83,750
Aggressive: Around 83,184
Target Point: 88,366 (bullish) or 79,819 (bearish).
Market Outlook:
The price is currently testing a key support zone.
If the support holds, we may see a bullish reversal toward 88,366.
If the price breaks below the support, further downside to 79,819 is possible.
Technical Indicators:
Exponential Moving Averages (EMAs):
200 EMA (blue): 85,984 (indicates long-term trend support/resistance).
30 EMA (red): 85,705 (short-term trend direction).
Support & Resistance Zones:
Purple Zone (Support Area): This area has been tested multiple times and is expected to provide a strong buying zone.
Resistance/Target Levels:
Upper EA Target Point: 88,366 (potential bullish target).
Lower EA Target Point: 79,819 (potential bearish target).
Trade Setup:
Entry Point: Around 83,810 (current price near support).
Stop Loss Levels:
Conservative: Around 83,750
Aggressive: Around 83,184
Target Point: 88,366 (bullish) or 79,819 (bearish).
Market Outlook:
The price is currently testing a key support zone.
If the support holds, we may see a bullish reversal toward 88,366.
If the price breaks below the support, further downside to 79,819 is possible.

JOIN MY TELEGRAM CHANNEL
t.me/+wtxM9EtZ_AVjYmFk
t.me/+wtxM9EtZ_AVjYmFk
t.me/+wtxM9EtZ_AVjYmFk
t.me/+wtxM9EtZ_AVjYmFk
Feragatname
Bilgiler ve yayınlar, TradingView tarafından sağlanan veya onaylanan finansal, yatırım, alım satım veya diğer türden tavsiye veya öneriler anlamına gelmez ve teşkil etmez. Kullanım Koşulları bölümünde daha fazlasını okuyun.
JOIN MY TELEGRAM CHANNEL
t.me/+wtxM9EtZ_AVjYmFk
t.me/+wtxM9EtZ_AVjYmFk
t.me/+wtxM9EtZ_AVjYmFk
t.me/+wtxM9EtZ_AVjYmFk
Feragatname
Bilgiler ve yayınlar, TradingView tarafından sağlanan veya onaylanan finansal, yatırım, alım satım veya diğer türden tavsiye veya öneriler anlamına gelmez ve teşkil etmez. Kullanım Koşulları bölümünde daha fazlasını okuyun.